1. Why QoE meets Machine Intelligence Now
[Multimedia systems are evolving towards AI-driven, adaptive services, leading to a natural convergence of QoE and machine intelligence. In this context, machine intelligence can empower QoE through learning-based, context-aware, and semantic-driven modelling and optimization. At the same time, QoE can guide machine intelligence by providing a human-centred objective for AI system design and evaluation; see also [11]. Looking beyond human perception, toward agent-centric and hybrid QoE, future multimedia systems increasingly require unified experience objectives that support human-AI co-experience. QoMEX’26 in Cardiff stands as a major milestone highlighting the convergence of Quality of Multimedia Experience with Machine Intelligence. This column reflects on this evolution and outlines the key challenges ahead.
Multimedia systems have shifted from “best-effort delivery” toward intelligent, adaptive services that operate under highly diverse network conditions, device capabilities, and user contexts. In this landscape, Quality of Experience (QoE) has become a central concept, focusing on user satisfaction rather than purely signal-level fidelity [1, 2, 3].
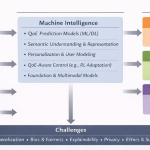
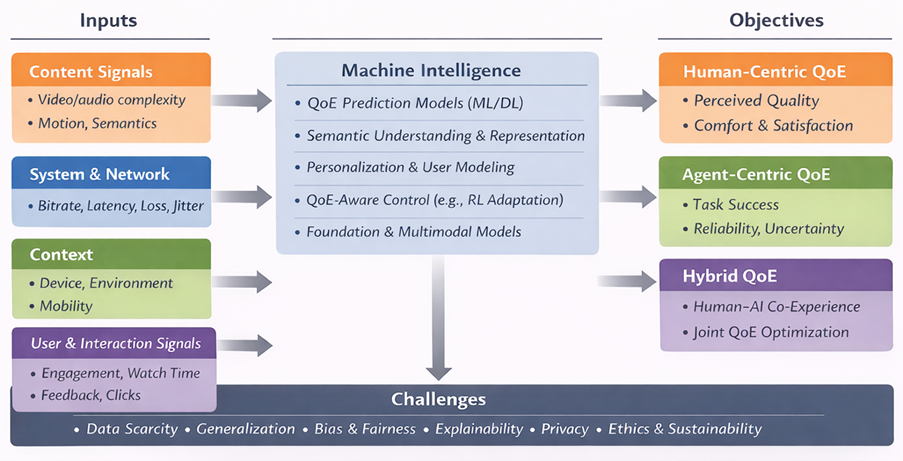
QoE has traditionally been human-centric, reflecting perceived quality, enjoyment, comfort, and acceptance of multimedia services [2]. Meanwhile, machine intelligence, from deep learning and reinforcement learning to multimodal foundation models, has rapidly become the dominant paradigm for perception, generation, and decision-making. The intersection of these trends is timely and inevitable: QoE provides the human-centred goal, while machine intelligence provides scalable tools to model and optimize experience in complex real-world environments. Figure 1 summarizes this bidirectional relationship between QoE and machine intelligence, from multimodal inputs to human-centric, agent-centric, and hybrid QoE objectives.
2. How machine intelligence can empower QoE
(1) Learning QoE models beyond handcrafted rules
Classic QoE models often rely on handcrafted features and simplified assumptions linking system parameters (bitrate, delay, resolution) to perceived quality. Machine learning offers a flexible alternative: it can learn complex nonlinear mappings from content, network conditions, and user interaction signals to QoE outcomes. Deep models further enable learning from high-dimensional inputs such as raw video frames, audio signals, and multimodal logs, supporting richer QoE prediction in streaming, immersive media, short-form video, gaming, and interactive communication. In this context, advances in perceptual quality assessment (e.g., full-reference and no-reference IQA/VQA) also provide useful foundations for QoE-related modelling [5, 8, 9].
(2) QoE-aware control and optimization
Machine intelligence is not only about prediction, it can also enable QoE-driven decision-making. Instead of optimizing network metrics alone, systems can adapt encoding, bitrate selection, buffering strategies, or rendering policies to maximize predicted QoE. This direction has been extensively studied in adaptive streaming, where QoE-driven strategies are used to balance bitrate quality and playback stability [4]. Reinforcement learning is particularly promising, where QoE can serve as a reward signal and agents can learn robust policies under uncertainty (e.g., bandwidth fluctuations, user engagement changes) [6, 7].
(3) Personalization and context-awareness
QoE is inherently subjective and context-dependent. Machine intelligence can support personalization by incorporating user preferences and context signals such as device type, mobility, ambient environment, and usage patterns. For example, some users are more sensitive to rebuffering events, while others prioritize sharpness and resolution. Context-aware learning enables systems to move beyond “one-size-fits-all” adaptation.
(4) Semantic Intelligence
Machine intelligence can empower QoE by shifting quality assessment from perceptual fidelity toward semantic quality. This means how well the meaning and task-relevant information of multimodal content is preserved for both machines and humans. As multimedia data is increasingly consumed by AI systems in applications like autonomous systems and AI-generated content pipelines, traditional perceptual metrics fail to reflect performance and experience because they ignore semantic consistency. Semantic-aware evaluation may enable task-oriented and task-agnostic assessment. By integrating semantic quality assessment, AI can guide compression, transmission, and system design in ways that better align technical performance with downstream task success and user experience.
3. How QoE can guide machine intelligence
The relationship between QoE and machine intelligence is bidirectional: QoE can also shape how multimedia AI systems are designed, trained, and evaluated.
(1) QoE as a human-centric objective function
Many multimedia AI pipelines optimize proxy metrics such as accuracy, PSNR/SSIM, or task performance. However, these do not always align with perceived quality or user satisfaction. QoE provides a principled framework to define what “better” means from the user’s perspective and encourages evaluation beyond technical fidelity [2, 10].
(2) Aligning generative intelligence with user satisfaction
With the rise of generative AI for multimedia enhancement and creation, QoE becomes even more critical. High-quality generation is not only about realism but also about temporal consistency, comfort, trust, and acceptance in real usage conditions. Integrating QoE considerations can help steer generative models toward outcomes that users actually prefer.
Emerging Challenge “QoE of interactive AI systems”
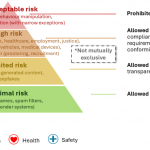
AI evaluation is shifting from pure model accuracy toward experience-based assessment of how humans interact with AI, aligned with frameworks like the EU AI Act. Quality of Experience (QoE) and UX research provide established methods to measure subjective aspects such as trust, transparency, human oversight of the AIS systems, robustness, and satisfaction. Applying QoE methodologies can translate high-level AI principles into measurable experiential dimensions reflecting real-world user understanding and use. This requires new metrics that reflect how users actually understand, trust and operate AI systems in practice. For more details, see [11].
4. Beyond human-centric QoE: toward agent-centric and hybrid QoE
While QoE has historically focused on human perception, emerging multimedia systems increasingly serve autonomous agents such as robots, drones, and intelligent vehicles. In these scenarios, multimedia is not only consumed by humans but also by machines. This motivates an extended view of QoE, agent-centric QoE, where “experience” can be interpreted as the utility of multimedia inputs for decision-making and task execution.
Agent-centric QoE can be characterized through indicators such as perception reliability, uncertainty reduction, latency sensitivity, safety margins, energy efficiency, and task success rate. Importantly, many future applications involve human–AI co-experience, for example, in teleoperation, remote driving, robot-assisted inspection, and collaborative XR. In such systems, overall quality depends on both human satisfaction and machine performance, motivating unified QoE objectives that jointly optimize human-centric and agent-centric requirements. As shown in Figure 1, future multimedia systems may require unified QoE objectives that jointly optimize human satisfaction and agent utility in human–AI co-experience scenarios.
5. Key challenges
Despite its promise, QoE-meets-AI research faces several open challenges:
- Subjective data cost and scarcity: QoE ground truth often requires user studies and careful experimental design [2, 3].
- Generalization: QoE models may struggle across unseen content types, devices, or cultural contexts.
- Bias and fairness: QoE datasets may underrepresent certain user groups or contexts, leading to skewed optimization.
- Explainability and trust: Black-box QoE predictions can be difficult to interpret and validate in engineering pipelines.
- Privacy: Personalization requires user data, raising responsible data usage concerns.
- Ethical aspects: Beyond established research ethics procedures, QoE research must increasingly address the broader ethical implications of AI-driven experience optimization, such as fairness, transparency, wellbeing, privacy, and environmental impact, which are essential for truly human-centred technology.
6. Outlook and takeaways
The convergence of Quality of Experience and machine intelligence represents a major opportunity for the multimedia community. Machine intelligence offers scalable tools to predict and optimize QoE in complex environments, while QoE provides a human-centred lens to guide AI system design toward real user value. Looking forward, QoE may evolve from a purely human-centric notion to a hybrid experience shared by humans and intelligent agents, enabling multimedia systems that are not only technically advanced, but also aligned with what humans and autonomous agents truly need.
Looking ahead to the continued evolution of the QoMEX conference series, QoMEX’26 in Cardiff represents a key milestone where Quality of Multimedia Experience directly converges with Machine Intelligence. As AI increasingly shapes how multimedia is created, transmitted, and consumed, the conference invites the community to rethink both the goals and methods of QoE research – using AI to enhance user experience, while drawing on QoE insights to build more human-aware, trustworthy, and adaptive intelligent systems. This vision is reflected in special sessions:
“SS1: Semantic Quality Assessment for Multi-Modal Intelligent Systems” on semantic quality assessment for multimodal intelligent systems, which extend quality evaluation beyond perceptual fidelity toward meaning and task relevance. The session aims to lay the foundations of multimodal semantic quality assessment, enable semantic-driven compression and transmission, and connect semantic quality evaluation with AI understanding.
“SS2: Beyond Quality: Integrating Ethical Dimensions in QoE Research” on integrating ethical dimensions into QoE research, emphasizing fairness, transparency, wellbeing, privacy, and environmental impact, which are essential for truly human-centred technology. This session calls for ethically reflexive, value-sensitive QoE frameworks that incorporate social impact, collective QoE, and inclusive research practices alongside traditional UX measures.
Together, these themes signal a continued broadening of the QoE scope, reaffirming QoMEX as a forum that evolves with emerging technologies while advancing inclusive, responsible, and future-oriented quality research. The 18th International Conference on Quality of Multimedia Experience (QoMEX’26) will take place in Cardiff, United Kingdom, from June 29 to July 3, 2026. Please find more information on the website of QoMEX’26: https://qomex2026.itec.aau.at/

Reference
[1] ITU-T Rec. P.10/G.100 (2006), Vocabulary for performance and quality of service.
[2] Möller, S., & Raake, A. (2014), Quality of Experience: Advanced Concepts, Applications and Methods. Springer.
[3] De Moor, K., et al. (2010), Proposed framework for evaluating quality of experience in a mobile, testbed-oriented living lab setting. Mobile Networks and Applications.
[4] Seufert, M., Egger, S., Slanina, M., Zinner, T., Hoßfeld, T., & Tran-Gia, P. (2015), A survey on quality of experience of HTTP adaptive streaming. IEEE Communications Surveys & Tutorials.
[5] Bampis, C. G., Li, Z., Moorthy, A. K., Katsavounidis, I., Aaron, A., & Bovik, A. C. (2018), Study of temporal effects on subjective video quality of experience. IEEE Transactions on Image Processing.
[6] Yin, X., Jindal, A., Sekar, V., & Sinopoli, B. (2015), A control-theoretic approach for dynamic adaptive video streaming over HTTP. ACM SIGCOMM.
[7] Mao, H., Netravali, R., & Alizadeh, M. (2017), Neural adaptive video streaming with Pensieve. ACM SIGCOMM.
[8] Wang, Z. & Bovik, AC. (2006), Modern image quality assessment. Springer.
[9] Mittal, A., Moorthy, A. K., & Bovik, A. C. (2013), No-reference image quality assessment in the spatial domain. IEEE Transactions on Image Processing.
[10] Hoßfeld, T., Schatz, R., & Egger, S. (2011), SOS: The MOS is not enough! QoMEX.
[11] Hupont, I., De Moor, K, Skorin-Kapov, L., Varela, M. & Hoßfeld, T. “Rethinking QoE in the Age of AI: From Algorithms to Experience-Based Evaluation.” ACM SIGMultimedia Records (2025).