To the viewer, a stalled video is a single
interruption; operationally, it fragments into different pieces of evidence.
The streaming application records a bitrate drop and a rebuffering event, the
network operator’s dashboard shows a congested access segment and a burst of
packet loss, and the user experience sits between those two partial accounts.
This gap in visibility is the practical problem behind VQEG’s March 2026 white paper Quality of Experience-Aware Management for Collaboration Between Network and Application Providers, published as technical report VQEG_TR_2026_001 [VQEG, 2026]. Its guiding question is direct but difficult: if Content and Application Providers (CAPs) and Communication Service Providers (CSPs) both shape end-user Quality of Experience (QoE), what would they need to share in order to manage it together?
The Case for a
Common QoS/QoE Vision
VQEG, the Video Quality Experts Group, is an
international forum focused on video quality and QoE measurement. The VQEG
5G-KPI working group studies the relationship between network key performance
indicators (KPIs), initially in 5G and extensible to other networks, and the
QoE of video services running on top of them. At a July 2024 workshop in
Klagenfurt, Austria, the group turned that broad mission into a more concrete
agenda around a familiar problem in multimedia delivery: applications and
networks are deeply entangled, yet the communities operating them often
describe performance in different measurements.
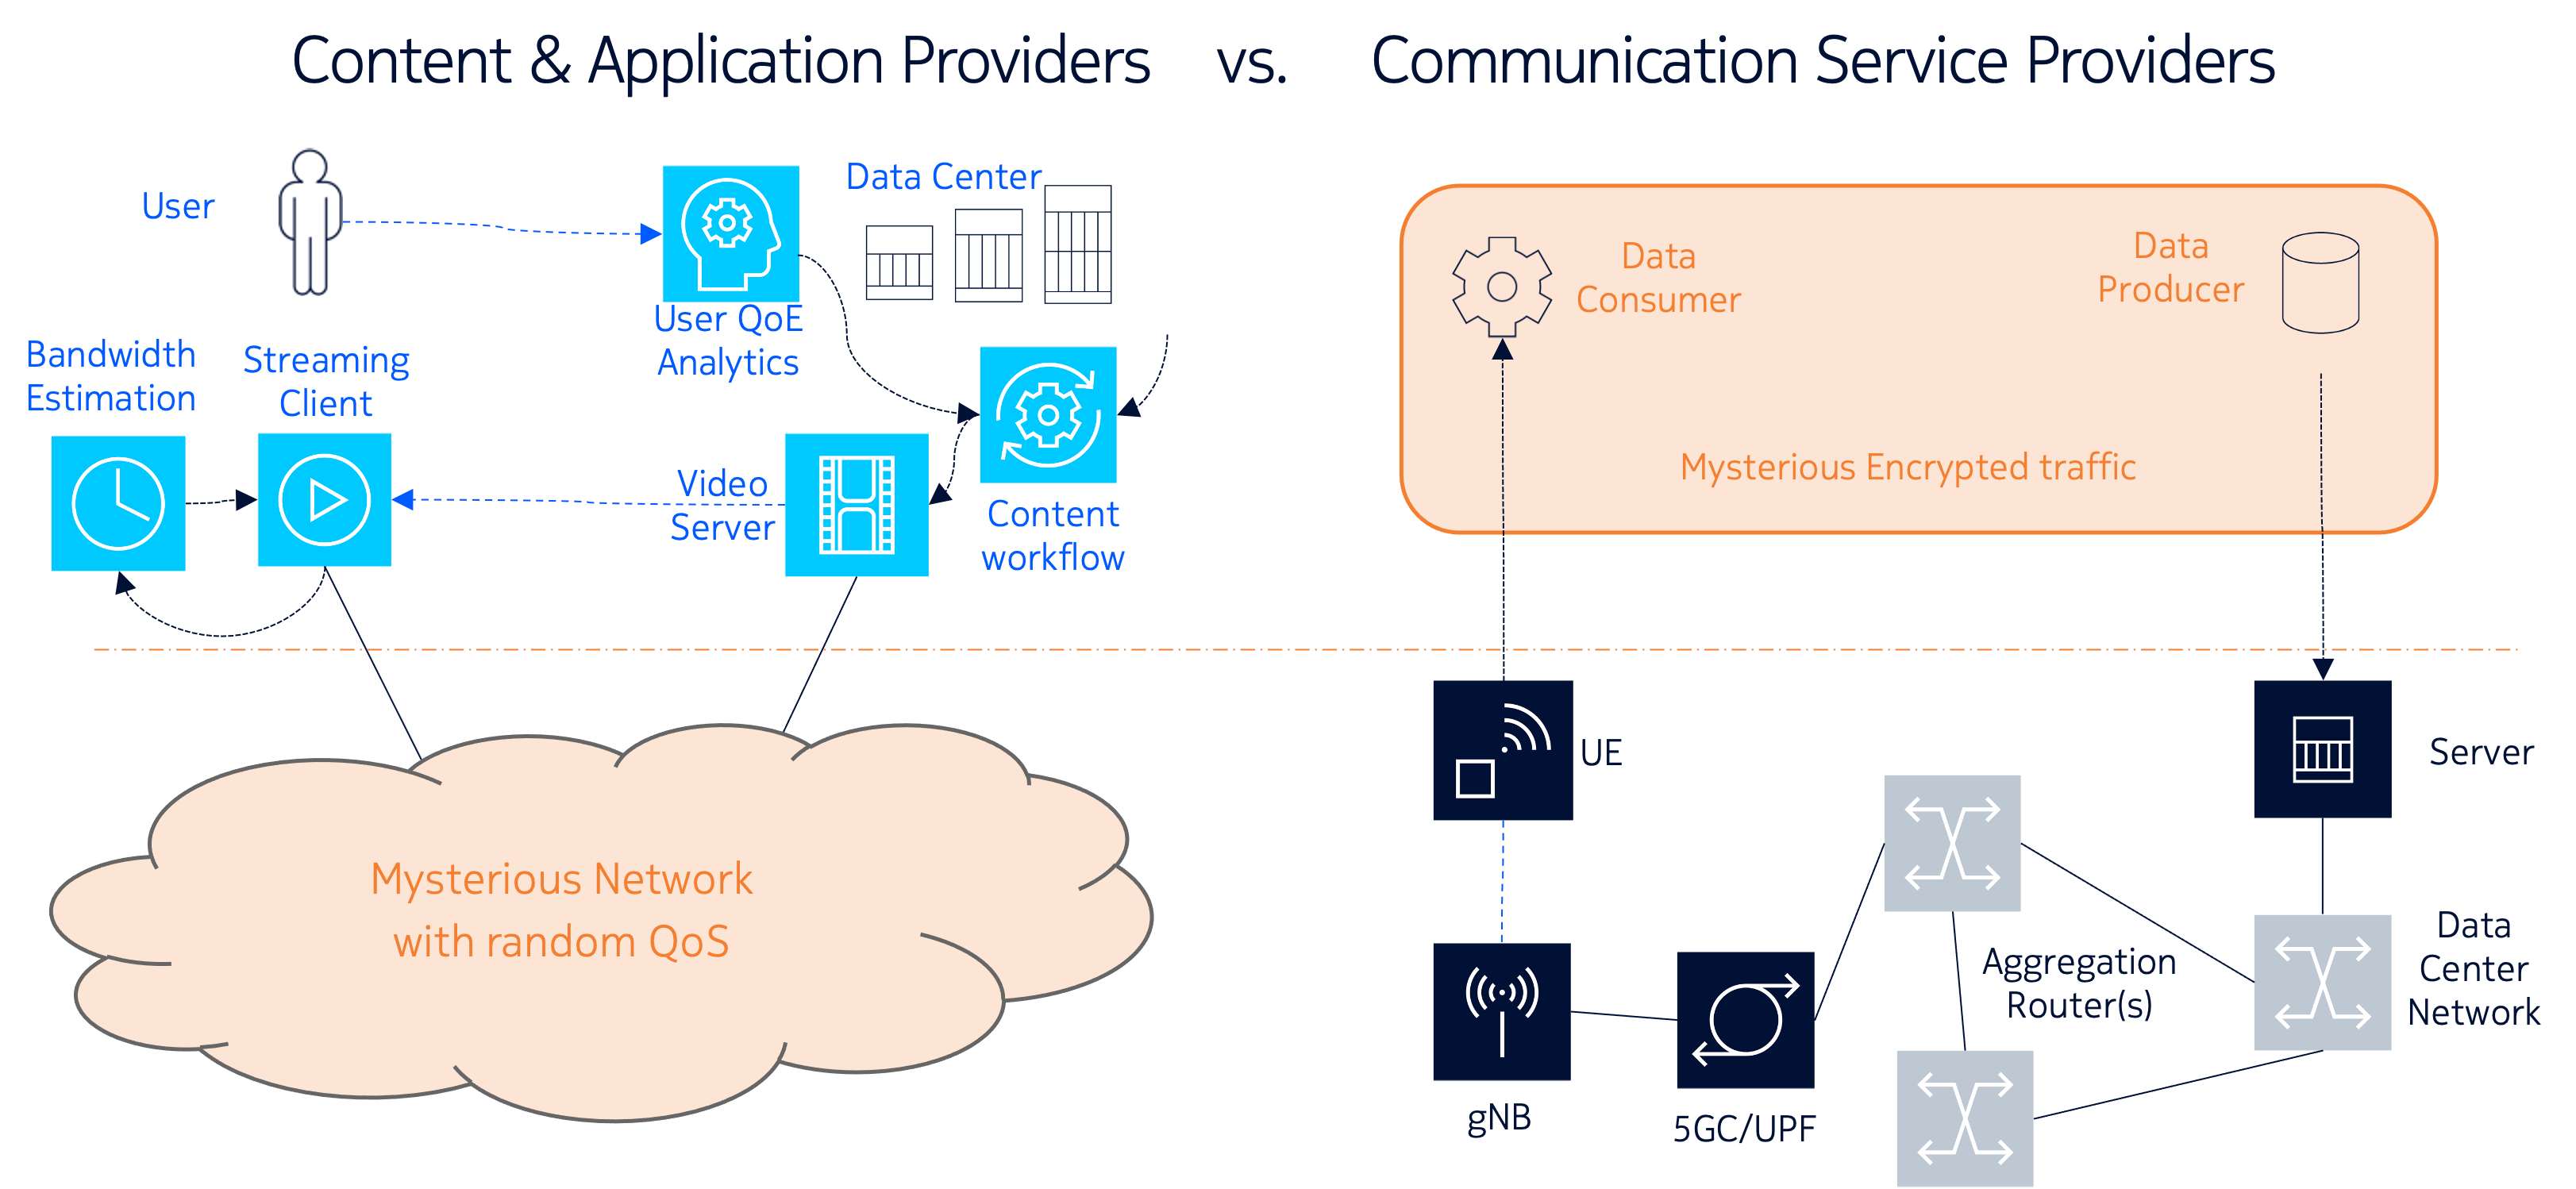
CAPs can typically observe the application layer: startup time, player state, bitrate switches, rebuffering, device behavior, error logs, and user-facing quality. However, they have no visibility on the network topology or performance, and they need to devote significant effort in developing throughput estimation algorithms and control techniques to adapt to varying network conditions. CSPs, in turn, can observe the network layer: throughput, latency, jitter, packet loss, routing, congestion, and radio or access-network conditions. However, they have no visibility on the kind of traffic they transport, especially when it is encrypted, and therefore they have difficulties in properly dimensioning the network or provided focused support to customer problems. Figure 1 illustrates this split visibility across the delivery chain and the shared view that QoE-aware management tries to build between CAPs and CSPs.
Figure 1. CAPs and CSPs see different parts of the same delivery chain. CAPs observe application- and user-side quality signals; CSPs observe network-side conditions. QoE-aware management needs a shared view that connects these perspectives without assuming that either side sees the whole system alone.
The same divergence appears in the terminology.
In multimedia research, QoE is usually anchored in the user’s experience,
following the widely used Qualinet definition of QoE [Qualinet, 2013] as “the degree of delight or
annoyance of the user of an application or service,” shaped by the user’s
personality, state, expectations, context, and the system itself. This
definition keeps the human being in the picture: a model may estimate QoE, and
a subjective test may measure it more directly, but the object of interest
remains experienced quality.
In networking practice, the starting point is
usually Quality of Service (QoS). Metrics such as bandwidth, latency, jitter,
and packet loss are measurable, operational, and essential, although they tell
only part of the story. A network policy that reduces bitrate may ease
congestion and improve latency while the viewer sees a picture that has become
visibly worse; a cloud-gaming session may report decent throughput while the
player feels the input delay immediately. QoS counters become much more useful
when they can be connected to application-level Key Quality Indicators (KQIs),
modeled QoE, user-reported QoE, and system QoE [Hoßfeld,
2019].
From the Klagenfurt discussions emerged four
needs: a shared vocabulary for QoS and QoE-related concepts; a practical way to
model QoS-QoE relationships; requirements for exchanging information between
CAPs and CSPs; and early validation through concrete use cases. Before any
mechanism could be specified, the group first had to make the language precise
enough for both sides to use.
Writing the White Paper
For the organizations that would actually have
to operate QoE management, the resulting report frames the problem in practical
terms. Which metrics can CAPs and CSPs agree on?Which ones can they
expose to one another? How should those measurements be interpreted? When can
they trigger action during a session, and when are they more useful afterward
for analytics, troubleshooting, or network dimensioning?
The focus on CAPs and CSPs is deliberate because
these stakeholders control different parts of the delivery chain. CAPs provide
the application or content experience directly to users, while CSPs provide the
communication network on which that experience depends. Between them sit
devices, access networks, transport networks, content delivery networks,
adaptation algorithms, service policies, and business constraints. A video
freeze, a cloud-gaming delay, or a broken conference call may involve several of
those layers at once, which gives a shared operating language practical value.
Because the contributors come from CAPs, CSPs,
equipment vendors, universities, research institutes, and independent QoE
experts, the report also reflects a range of operational and research
perspectives. The mix includes, among others, Nokia, Meta, YouTube, RISE,
Telefónica, AT&T, Ericsson, TikTok, Audible, AVEQ, RWTH Aachen, TU Ilmenau,
the University of Padova, the University of Würzburg, Blekinge Institute of
Technology, AGH, and Universidad Politécnica de Madrid. That breadth is
important: different communities brought different habits, constraints, and
preferred measurements into the same conversation.
Published as VQEG_TR_2026_001 in March 2026, the
report reviews definitions, QoE models, and relevant standards; organizes the
relationships among QoS, KPIs, KQIs, and QoE; CAP-CSP collaboration challenge;
and proposes a conceptual framework for exchanging QoS- and QoE-related
information. Its examples include short-form video, long-form video, cloud
gaming, and video conferencing. Although the scope is broad, the center of
gravity remains practical: give the ecosystem a common foundation before
arguing about protocols or product-specific tools.
Some Highlights
One of the report’s central contributions is its
layered vocabulary. Borrowing the intuition of a networking stack, while still
keeping user experience above packet-level quantities, it separates network
KPIs such as throughput, latency, and loss [3GPP, 2024]
from application KQIs [3GPP QMC, 2025] such as startup
delay, rebuffering, media quality, interaction delay, and session stability.
Above those layers sits QoE: the user’s perceived quality, whether reported
directly or inferred through a model. Terms such as user-reported QoE, modeled
QoE, and system QoE receive explicit treatment because collaboration breaks
down quickly when a “quality score” means one thing in the player logs and
another thing in the network dashboard.
The layered vocabulary also changes the
diagnostic problem. A CAP may know that a session suffered repeated stalls and
bitrate drops, while the CSP may know that the access link was congested at the
same time. If those observations can be correlated, both sides can move from
guessing to diagnosis: application issue, network congestion, device
limitation, or some interaction among them. Better diagnosis can help a CSP
decide where network action is warranted, help a CAP adapt more intelligently,
and help both sides avoid optimizations that improve a local metric while
leaving the user unhappy.
The shared state table is the report’s most
concrete proposal: a logical view where CAPs and CSPs exchange selected
metrics, at appropriate time scales and levels of aggregation, so each side can
understand enough of the other’s state to act. For video streaming, such a
table might include application-side information such as startup delay,
rebuffering, selected representation, or estimated visual quality, alongside
network-side information such as congestion indicators or available capacity.
For interactive services, the useful signals may shift toward latency, jitter,
and responsiveness.
Flexibility is built into the proposal because
different services need different metrics, and the useful time scale for a live
video call differs from the time scale for post-session analytics. The
difficult questions are the operational ones: who can measure a signal
reliably, who can act on it, how granular the exchange should be, and how
privacy or business constraints shape what can be exposed. Metric sharing
remains voluntary and opt-in, with mechanisms such as temporary or
pseudonymized session identifiers when granular traffic correlation is needed.
What is next?
Seen in this light, the report functions as a
foundation for implementation work. It offers a vocabulary, a framework, and a
set of open tasks that still need to be made operational. A sensible next step
would be to choose one use case and make the model concrete by selecting the
relevant metrics, deciding who measures them, defining how they map to QoE, and
testing whether the information would actually help CAPs and CSPs make better
decisions.
A proof of concept, controlled testbed, or
simulation, which is currently under discussion in VQEG, could then address the
focused feasibility questions. Can the selected metrics be measured
reliably? How fast must they be shared? Does per-session information add enough
value to justify the complexity? Which side can take action, and what action is
safe?
Deployment would also require careful treatment
of the operational details surrounding the framework itself. CAPs and CSPs need
ways to identify and correlate traffic flows. QoS monitoring must cover enough
of the path to find problems where they occur and keep teams from merely
shifting blame from one segment to another. Privacy, commercial sensitivity,
and regulation will shape what can be shared. The technical framework will have
to live inside those constraints.
For the idea to travel beyond a VQEG report, it
will also need a standardization path. Parts of the framework may fit naturally
in ITU-T Study Group 12, while protocol and system aspects may belong in IETF,
3GPP, MPEG, or related Standards Developing Organizations (SDOs). If that work
succeeds, QoE can move from post-session evaluation toward a shared operating
language for services and networks.
[3GPP KPI, 2024] 3GPP TS 28.554 V20.1.0 (2026-03). Technical Specification. 3rd Generation Partnership Project; Technical Specification Group Services and System Aspects; Management and orchestration; 5G end to end Key Performance Indicators (KPI) (Release 20)
[Multimedia systems are evolving towards AI-driven, adaptive services, leading to a natural convergence of QoE and machine intelligence. In this context, machine intelligence can empower QoE through learning-based, context-aware, and semantic-driven modelling and optimization. At the same time, QoE can guide machine intelligence by providing a human-centred objective for AI system design and evaluation; see also [11]. Looking beyond human perception, toward agent-centric and hybrid QoE, future multimedia systems increasingly require unified experience objectives that support human-AI co-experience. QoMEX’26 in Cardiff stands as a major milestone highlighting the convergence of Quality of Multimedia Experience with Machine Intelligence. This column reflects on this evolution and outlines the key challenges ahead.
Multimedia systems have shifted from “best-effort delivery” toward intelligent, adaptive services that operate under highly diverse network conditions, device capabilities, and user contexts. In this landscape, Quality of Experience (QoE) has become a central concept, focusing on user satisfaction rather than purely signal-level fidelity [1, 2, 3].
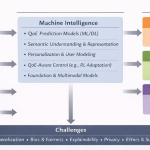
QoE has traditionally been human-centric, reflecting perceived quality, enjoyment, comfort, and acceptance of multimedia services [2]. Meanwhile, machine intelligence, from deep learning and reinforcement learning to multimodal foundation models, has rapidly become the dominant paradigm for perception, generation, and decision-making. The intersection of these trends is timely and inevitable: QoE provides the human-centred goal, while machine intelligence provides scalable tools to model and optimize experience in complex real-world environments. Figure 1 summarizes this bidirectional relationship between QoE and machine intelligence, from multimodal inputs to human-centric, agent-centric, and hybrid QoE objectives.
Figure 1. A conceptual framework where machine intelligence enables QoE prediction and QoE-aware optimization, while QoE evolves from a human-centric notion toward agent-centric and hybrid objectives in intelligent multimedia systems.
2. How
machine intelligence can empower QoE
(1) Learning QoE models beyond handcrafted rules
Classic QoE models often rely on handcrafted features and simplified assumptions linking system parameters (bitrate, delay, resolution) to perceived quality. Machine learning offers a flexible alternative: it can learn complex nonlinear mappings from content, network conditions, and user interaction signals to QoE outcomes. Deep models further enable learning from high-dimensional inputs such as raw video frames, audio signals, and multimodal logs, supporting richer QoE prediction in streaming, immersive media, short-form video, gaming, and interactive communication. In this context, advances in perceptual quality assessment (e.g., full-reference and no-reference IQA/VQA) also provide useful foundations for QoE-related modelling [5, 8, 9].
(2) QoE-aware control and optimization
Machine intelligence is not only about prediction, it can also enable QoE-driven decision-making. Instead of optimizing network metrics alone, systems can adapt encoding, bitrate selection, buffering strategies, or rendering policies to maximize predicted QoE. This direction has been extensively studied in adaptive streaming, where QoE-driven strategies are used to balance bitrate quality and playback stability [4]. Reinforcement learning is particularly promising, where QoE can serve as a reward signal and agents can learn robust policies under uncertainty (e.g., bandwidth fluctuations, user engagement changes) [6, 7].
(3) Personalization and context-awareness
QoE is inherently subjective and
context-dependent. Machine intelligence can support personalization by
incorporating user preferences and context signals such as device type,
mobility, ambient environment, and usage patterns. For example, some users are
more sensitive to rebuffering events, while others prioritize sharpness and
resolution. Context-aware learning enables systems to move beyond
“one-size-fits-all” adaptation.
(4) Semantic
Intelligence
Machine intelligence can empower QoE by shifting quality assessment from perceptual fidelity toward semantic quality. This means how well the meaning and task-relevant information of multimodal content is preserved for both machines and humans. As multimedia data is increasingly consumed by AI systems in applications like autonomous systems and AI-generated content pipelines, traditional perceptual metrics fail to reflect performance and experience because they ignore semantic consistency. Semantic-aware evaluation may enable task-oriented and task-agnostic assessment. By integrating semantic quality assessment, AI can guide compression, transmission, and system design in ways that better align technical performance with downstream task success and user experience.
3. How QoE
can guide machine intelligence
The relationship between QoE and
machine intelligence is bidirectional: QoE can also shape how multimedia AI
systems are designed, trained, and evaluated.
(1) QoE as a human-centric objective function
Many multimedia AI pipelines optimize proxy metrics such as accuracy, PSNR/SSIM, or task performance. However, these do not always align with perceived quality or user satisfaction. QoE provides a principled framework to define what “better” means from the user’s perspective and encourages evaluation beyond technical fidelity [2, 10].
(2) Aligning generative intelligence with user
satisfaction
With the rise of generative AI for
multimedia enhancement and creation, QoE becomes even more critical.
High-quality generation is not only about realism but also about temporal
consistency, comfort, trust, and acceptance in real usage conditions. Integrating
QoE considerations can help steer generative models toward outcomes that users
actually prefer.
Emerging Challenge “QoE of interactive AI systems”
AI evaluation is shifting from pure model accuracy toward experience-based assessment of how humans interact with AI, aligned with frameworks like the EU AI Act. Quality of Experience (QoE) and UX research provide established methods to measure subjective aspects such as trust, transparency, human oversight of the AIS systems, robustness, and satisfaction. Applying QoE methodologies can translate high-level AI principles into measurable experiential dimensions reflecting real-world user understanding and use. This requires new metrics that reflect how users actually understand, trust and operate AI systems in practice. For more details, see [11].
4. Beyond human-centric QoE: toward agent-centric and hybrid
QoE
While QoE has historically focused on
human perception, emerging multimedia systems increasingly serve autonomous
agents such as robots, drones, and intelligent vehicles. In these scenarios,
multimedia is not only consumed by humans but also by machines. This motivates
an extended view of QoE, agent-centric QoE, where “experience” can be
interpreted as the utility of multimedia inputs for decision-making and task
execution.
Agent-centric QoE can be characterized through indicators such as perception reliability, uncertainty reduction, latency sensitivity, safety margins, energy efficiency, and task success rate. Importantly, many future applications involve human–AI co-experience, for example, in teleoperation, remote driving, robot-assisted inspection, and collaborative XR. In such systems, overall quality depends on both human satisfaction and machine performance, motivating unified QoE objectives that jointly optimize human-centric and agent-centric requirements. As shown in Figure 1, future multimedia systems may require unified QoE objectives that jointly optimize human satisfaction and agent utility in human–AI co-experience scenarios.
5. Key challenges
Despite its promise, QoE-meets-AI
research faces several open challenges:
Subjective data cost and scarcity: QoE ground truth often requires user studies and careful experimental design [2, 3].
Generalization: QoE models may struggle across unseen content types, devices, or cultural contexts.
Bias and fairness: QoE datasets may underrepresent certain user groups or contexts, leading to skewed optimization.
Explainability and trust: Black-box QoE predictions can be difficult to interpret and validate in engineering pipelines.
Privacy: Personalization requires user data, raising responsible data usage concerns.
Ethical aspects: Beyond established research ethics procedures, QoE research must increasingly address the broader ethical implications of AI-driven experience optimization, such as fairness, transparency, wellbeing, privacy, and environmental impact, which are essential for truly human-centred technology.
6. Outlook and takeaways
The convergence of Quality of
Experience and machine intelligence represents a major opportunity for the
multimedia community. Machine intelligence offers scalable tools to predict and
optimize QoE in complex environments, while QoE provides a human-centred lens
to guide AI system design toward real user value. Looking forward, QoE may
evolve from a purely human-centric notion to a hybrid experience shared by
humans and intelligent agents, enabling multimedia systems that are not only
technically advanced, but also aligned with what humans and autonomous agents
truly need.
Looking ahead to the continued evolution of the QoMEX conference series, QoMEX’26 in Cardiff represents a key milestone where Quality of Multimedia Experience directly converges with Machine Intelligence. As AI increasingly shapes how multimedia is created, transmitted, and consumed, the conference invites the community to rethink both the goals and methods of QoE research – using AI to enhance user experience, while drawing on QoE insights to build more human-aware, trustworthy, and adaptive intelligent systems. This vision is reflected in special sessions: “SS1: Semantic Quality Assessment for Multi-Modal Intelligent Systems” on semantic quality assessment for multimodal intelligent systems, which extend quality evaluation beyond perceptual fidelity toward meaning and task relevance. The session aims to lay the foundations of multimodal semantic quality assessment, enable semantic-driven compression and transmission, and connect semantic quality evaluation with AI understanding. “SS2: Beyond Quality: Integrating Ethical Dimensions in QoE Research” on integrating ethical dimensions into QoE research, emphasizing fairness, transparency, wellbeing, privacy, and environmental impact, which are essential for truly human-centred technology. This session calls for ethically reflexive, value-sensitive QoE frameworks that incorporate social impact, collective QoE, and inclusive research practices alongside traditional UX measures.
Together, these themes signal a continued broadening of the QoE scope, reaffirming QoMEX as a forum that evolves with emerging technologies while advancing inclusive, responsible, and future-oriented quality research. The 18th International Conference on Quality of Multimedia Experience (QoMEX’26) will take place in Cardiff, United Kingdom, from June 29 to July 3, 2026. Please find more information on the website of QoMEX’26: https://qomex2026.itec.aau.at/
18th International Conference on Quality of Multimedia Experience (QoMEX’26) will take place in Cardiff, United Kingdom, from June 29 to July 3, 2026
Reference
[1] ITU-T Rec. P.10/G.100 (2006), Vocabulary for performance and quality of service.
AI evaluation is undergoing a paradigm shift from focusing solely on algorithmic accuracy of AI models to emphasizing experience-based assessment of human interactions with AI systems. Under frameworks like the EU AI Act, evaluation now considers intended purpose, risk, transparency, human oversight, and real-world robustness alongside accuracy. Quality of Experience (QoE) methodologies may offer a structured approach to evaluate how users perceive and experience AI systems in terms of transparency, trust, control and overall satisfaction. This column gives inspiration and shared insights for both communities to advance experience-based AI system evaluation together.
1. From algorithms to systems: AI as user experience
Artificial Intelligence (AI) algorithms—mathematical models implemented as lines of code and trained on data to predict, recommend or generate outputs—were, until recently, tools reserved for programmers and researchers. Only those with technical expertise could access, run or adapt them. For decades, progress in AI was equated with improvements in algorithmic performance: higher accuracy, better precision or new benchmark records—often achieved under narrow, controlled conditions that did not reflect the full spectrum of real-world operational environments. These advances, though scientifically impressive, remained largely invisible to society at large.
The turning point came when AI stopped being just code and became an experience accessible to everyone, regardless of their technical background. Once algorithms were embedded into interactive systems—chatbots, voice assistants, recommendation platforms, image generators—AI became ubiquitous, integrated into people’s daily lives. Interfaces transformed technical capability into human experience, making AI not only a purely algorithmic or research-oriented field but also a social, experiential and increasingly public phenomenon [Mlynář et al., 2025].
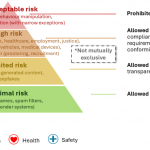
This shift fundamentally changed what it means to evaluate AI [Bach et al., 2024]. Accuracy-based metrics—such as precision, recall, specificity or F1-score—no longer suffice for systems that mediate human experiences, influence decision-making and shape trust. Evaluation must now extend beyond the model’s internal performance to assess the interaction, context and experience that emerge when humans engage with AI systems in realistic conditions. We must therefore move from evaluating algorithms in isolation to genuinely human-centered approaches to AI and the experiences it enables [see e.g., https://hai.stanford.edu/], evaluating AI systems as a whole, holistically—considering not only their technical performance but also their experiential, contextual, and social impact [Shneiderman, 2022]. The European Union’s Artificial Intelligence Act [AI Act, 2024] provides a clear illustration of this shift. As the first comprehensive regulatory framework for AI, it recognizes that while algorithmic quality remains essential, what is ultimately regulated is the AI system—its design, use, and intended purpose. Obligations under the Act are tied to that intended purpose, which determines both the risk level and the compliance requirements (see figure below). For instance, the same object detection model can be considered low risk when used to organize personal photo libraries, but high risk when deployed in an autonomous vehicle’s collision-avoidance system.
Figure 1. The European Union’s Artificial Intelligence Act [AI Act, 2024]: risk and obligations depend on an AI system’s intended purpose—permitting low-risk uses while restricting or prohibiting high-risk applications. Examples in the figure are illustrative, not exhaustive. Some uses require prior authorisation under the EU AI Act.
This illustrates a fundamental change: evaluating AI systems today requires understanding how, where and by whom a system is used—not merely how accurate its underlying AI model is. Moreover, evaluation must consider how systems behave and degrade under operational conditions (e.g., adverse weather in traffic monitoring or biased performance across demographic groups in facial analysis), how humans interact with, interpret and rely on them, and what mechanisms of human oversight or intervention exist in practice to ensure accountability and control [Panigutti et al., 2023].
2. Towards a paradigm shift in AI evaluation
The European AI Act marks the first comprehensive attempt to regulate the design, deployment and use of AI systems. Yet its underlying philosophy resonates broadly with the principles endorsed by other high-level international institutions and initiatives—such as the OECD [OECD, 2024], the World Economic Forum [WEF, 2025] and, more recently, the Paris AI Action Summit [CSIS, 2025], where over sixty countries signed a joint commitment to promote responsible, trustworthy and human-centric AI.
Among the many obligations set out in the AI Act for high-risk AI systems, three provisions stand out as emblematic of this paradigm shift: they focus not on algorithmic precision, but on how AI systems are experienced, supervised and operated in the real world.
Article 13 – Transparency. AI systems must be designed and developed in a way that is sufficiently transparent to enable users to interpret their output and use it appropriately. Transparency therefore extends beyond disclosure or documentation: it encompasses interaction design and interpretability, ensuring that users—especially non-experts—can meaningfully understand and act upon what the system produces, based on which input and how.
Article 14 – Human oversight. High-risk AI systems must allow for effective human supervision so that they can be used as intended and to prevent or minimise risks to health, safety or fundamental rights (e.g., respect for human dignity, privacy, equality and non-discrimination). Oversight involves not only control features or override mechanisms, but also interface designs that help operators recognise when human intervention is necessary—addressing known challenges such as automation bias and over-trust on AI systems [Gaudeul et al., 2024].
Article 15 – Accuracy, robustness and cybersecurity. This provision broadens the traditional notion of accuracy, demanding that systems perform reliably under real-world operational conditions and remain secure and resilient to errors, adversarial manipulation or context change. It also calls for mechanisms that support graceful degradation and error recovery, ensuring sustained trust and dependable performance over time.
These provisions, aligned to both the AI Act and the broader international discourse on responsible AI, express a clear transformation in how AI systems should be evaluated. They call for a move beyond in-lab algorithmic performance metrics to include criteria grounded in human experience, operational reliability and social trust. To make these requirements actionable, the European Commission issued a Standardisation Request on Artificial Intelligence (initially published as M/593, 2024 [European Commission, 2024] and subsequently updated following the adoption of the AI Act), mandating the development of harmonised standards to support conformity with the regulation. Yet analyses of existing AI standardisation frameworks suggest that they remain primarily focused on technical robustness and risk management, while offering limited methodological guidance for assessing transparency, human oversight and perceived reliability [Soler et al., 2023].
This gap underscores the need for contributions from the Quality of Experience (QoE) community, whose expertise in assessing perceived quality, pragmatic, hedonic and increasingly also eudaimonic aspects of users’ experiences, usability and trust could inform both standardisation efforts and AI system design in practice. For example, [Hammer et al., 2018] introduced the “HEP cube”, that is a 3D model that maps hedonic (H), eudaimonic (E), and pragmatic (P) aspects of QoE and user experience. For example, utility (P), joy-of-use (H), and meaningfulness (E) are integrated into a multidimensional HEP construct [Egger-Lampl et al., 2019]. In professional contexts, long-term experiential quality depends increasingly on eudaimonic factors such as meaning and personal growth of the user’s capabilities. On the example of augmented reality for the informational phase of procedure assistance, [Hynes et al., 2023] take into account pragmatic aspects like clear, accurately aligned AR instructions that reduce cognitive load and support efficient task execution; hedonic and eudaimonic aspects involve engaging, intuitive interactions that not only make the experience pleasant but also foster confidence, competence, and meaningful professional growth. The study confirmed that AR better fulfills users’ pragmatic needs compared to paper-based instructions. However, the hypothesis that AR surpasses paper-based instructions in meeting hedonic needs was rejected. [Oppermann et al., 2024] evaluated a VR-based forestry safety training and found improved experiential quality and real-world skill transfer compared to traditional instruction. In addition to hedonic and pragmatic UX, eudaimonic experience was assessed by asking participants whether the training would help them “make me a better forestry worker” and “develop my personal potential”.
3. From benchmark performance to operational reality: the case of facial recognition
The example of remote facial recognition (RFR) for public security clearly illustrates how traditional accuracy-based evaluation fails to capture the real challenges of proportionality, operational viability and public trust that define the true quality of experience of AI in use. Under the EU AI Act, the use of real-time remote biometric identification systems in publicly accessible spaces for law enforcement is prohibited, except in narrowly defined circumstances—such as the prevention of terrorist threats, the search for missing persons or the prosecution of crimes—and always subject to prior authorisation by a competent authority. In these cases, the authority must assess whether the deployment of such a system is necessary and proportionate to the intended purpose.
Both the AI Act and the World Economic Forum emphasise this principle of “proportionality” for face recognition systems [AI Act, 2024], [Louradour & Madzou, 2021], yet without providing a clear guidance to determine what “proportionate use” actually means. Deciding whether to deploy RFR therefore requires balancing multiple dimensions—technical performance, societal impact and human oversight—beyond mere accuracy scores [Negri et al., 2024]. Consider, for instance, a competent authority evaluating whether to deploy an RFR system in airports screening 200 million passengers annually, where the estimated prevalence of genuine threats is roughly one in fifty million. Even with a true positive rate (TPR) and true negative rate (TNR) of 99% (equivalent to 99% sensitivity and specificity), the outcome is paradoxical: nearly all real threats would be detected (≈ 4 per year), but around two million innocent passengers would face unnecessary police interventions. Algorithmically, a 99% performance looks excellent. Operationally, it is unmanageable and counterproductive. Handling millions of false alarms would overwhelm security forces, delay operations, and—most importantly—erode public trust, as citizens repeatedly experience unjustified scrutiny and loss of confidence in authorities.
Beyond accuracy, competent authorities must evaluate trade-offs between different operational, social and economic dimensions that holistically define the proportionality and viability of an AI system:
Operational feasibility: number of human interventions needed, false alarms to handle and system downtime.
Social impact: perceived fairness, legitimacy and transparency of interventions.
Economic cost: cost of system deployment, resources spent managing false positives versus genuine detections.
Human trust and cognitive load: how repeated interactions with the system affect operator confidence, vigilance and the balance between over-trust and alert fatigue.
Consequences of error: the cost of a missed detection versus that of an unjustified intervention.
Hence, accuracy alone cannot guarantee reliability or trustworthiness. Evaluating AI systems requires contextual and human-aware metrics that capture operational trade-offs and social implications. The goal is not only to predict well, but to perform well in the real world. This example reveals a broader truth: trustworthy AI demands evaluation methods that connect technical performance with lived experience—and this is precisely where the QoE community can make a distinctive contribution.
4. Where AI and QoE should meet: new metrics for a new era
The limitations of accuracy-based evaluation, as illustrated by the facial recognition case, point to a broader need for metrics that capture how AI systems perform in real-world, human-centred contexts [Virvou, 2023],[Park et al., 2023].
Over the past decades, the scientific communities focusing on QoE and user experience (UX) research have developed a rigorous toolbox for quantifying subjective experience—how users perceive quality, usability, pragmatic, hedonic and increasingly also eudaimonic aspects of users’ experiences, reliability, control and satisfaction when interacting with complex technological systems. Originally rooted in multimedia, communication networks and human–computer interaction, these methodologies offer a mature foundation for assessing experienced quality in AI systems. QoE-based approaches can help transform general principles such as transparency, human oversight and robustness into measurable experiential dimensions that reflect how users actually understand, trust and operate AI systems in practice.
The following table presents a set of illustrative examples of QoE-inspired metrics—adapted from long-standing practices in the field—that could be further adapted, developed and validated for the evaluation of trustworthy AI.
General AI principles
QoE-inspired metrics
Transparency and comprehensibility
Perceived transparency score: % of users reporting understanding of system capabilities/limitations, potentially with a way to dimension the gap between reported understanding and actual understanding Explanation clarity MOS: Mean Opinion Score on clarity and interpretability of explanations. While traditional QoE assessment results are often reported as a Mean Opinion Score (MOS), additional statistical measures related to the distribution of scores in the target population are of interest, such as user diversity, uncertainty of user rating distributions, ratio of dissatisfied users, etc. [Hoßfeld et al., 2016] Time to comprehension: average time for a non-expert to understand the meaning of a given output produced by the system. Experienced interpretability: extent to which users feel that explanations meaningfully enhance their understanding of the system’s reasoning and limitations [Wehner et al., 2025].
Human oversight
Perceived controllability: MOS on ease of intervening or correcting system behavior. Intervention success rate: % of interventions improving outcomes. Trust calibration index: alignment between user confidence and actual system reliability.
Robustness and resilience to errors
Perceived reliability over time: longitudinal QoE measure of stability (for example, inspired by work on the longitudinal development of QoE, such as [Guse, D., 2016], [Cieplinska, 2023]). Graceful degradation MOS: subjective quality under stress (e.g., noise, adversarial input). Error recovery satisfaction: % of users satisfied with post-failure recovery.
Experience quality (holistic)
Overall satisfaction MOS: overall perceived quality of interaction with the AI system and factors influencing that experience quality (human, system, context, as discussed in [Reiter et al.. 2014]. Smoothness of use: perceived fluidity, continuity, absence of frustration. Perceived usefulness and usability: e.g., adapted from widely-used SUS/UMUX-Lite scales [Lewis et al., 2013]. Perceived response alignment: capture to what extent the system response aligns semantically and contextually with the prompt intent (particularly relevant for generative AI systems). Cognitive load: mental effort perceived during operation (e.g., adapted NASA-TLX [Hart & Staveland, 1988]). Perceived productivity impact: how users perceive the effect of AI system assistance on task efficiency and cognitive effort, reflecting findings from recent large-scale developer studies [Early-2025 AI, AI hampers Productivity].
These examples illustrate how the QoE perspective can complement traditional performance indicators such as accuracy or robustness. They extend evaluation beyond technical correctness to include how people experience, trust and manage AI systems in operational environments. Of interest will be to further explore and model the complex relationships between identified QoE dimensions and underlying system, context and human influence factors.
To better illustrate such complex relationships, it is useful to consider how technical and experiential dimensions interact dynamically in use. One particularly relevant example concerns how AI systems communicate confidence or uncertainty, and how this shapes users’ perceived trustworthiness, engagement and overall Quality of Experience.
Figure 2. Positive and negative feedback loop between confidence and QoE of AI systems.
While this is only one example among many possible human–AI interaction dynamics, it illustrates the kind of interrelation that still requires deeper understanding. As depicted in the figure above, complex interrelations exist that are not yet fully understood. AI confidence calibration (based on the AI model) and the way how this confidence or uncertainty is transported to users influences the users’ perceived trustworthiness of the AI system. This impacts the user’s confidence to which degree a user trusts their own ability to understand, interpret, and effectively interact with the AI system. Poor calibration can trigger a negative feedback loop of mistrust and disengagement, while well-calibrated, transparent AI fosters a positive feedback loop that enhances trust, confidence, and effective human-AI collaboration. In a negative feedback loop, overconfidence leads to low perceived trustworthiness and a strong QoE decline, while underconfidence results in moderate perceived trustworthiness and medium QoE, ultimately lowering user engagement. In contrast, a positive feedback loop emerges when confidence is well-calibrated and aligns with accuracy or when uncertainty is expressed transparently, leading to high trust, higher QoE, and stronger user engagement. User engagement and QoE are closely interrelated [Reichl et al., 2015], as higher engagement often reflects and reinforces a more positive overall experience.
Following this and similar examples, the bridge that now needs to be built is between the AI community’s focus on algorithmic performance and the QoE community’s expertise in human experience, bringing together two perspectives that have evolved largely in isolation, but are inherently complementary.
5. Conclusions: QoE as part of the missing link between AI systems and real-world experiences
Bridging the gap between how AI systems perform and how they are experienced is now one of the most pressing challenges in the field. The AI community has achieved extraordinary advances in model accuracy, scalability and efficiency, yet these metrics alone do not fully capture how systems behave in context—how they interact with people, support oversight or sustain trust under real operating conditions. The field of QoE, with its long tradition of measuring perceived quality, different experiential dimensions and usability, offers the conceptual and methodological tools needed to evaluate AI systems as experienced technologies, not merely as computational artefacts.
In this context, QoE of AI systems can be adapted from the original definition of QoE as proposed in [Qualinet, 2013] to read as: “The degree of delight or annoyance of a user resulting from interacting with an AI system. It results from how well the AI system fulfills the user’s expectations regarding usefulness, transparency, trustworthiness, comprehensibility, controllability, and reliability, considering the user’s goals, context, and cognitive state.”
Collaborative research between these domains can foster new interdisciplinary methodologies, shared benchmarks and evidence-based guidelines for assessing AI systems as they are used in the real world—not just as they perform in the lab or within classical accuracy-centred benchmarks. Building this shared evaluation culture is essential to advance trustworthy, human-centric AI, ensuring that future systems are not only intelligent but also understandable, reliable and aligned with human values.
This need is becoming increasingly urgent as, in many regions such as the EU, the principles of trustworthy AI are evolving from ethical aspirations into formal regulatory requirements, reinforcing the importance of robust, experience-based evaluation frameworks.
References
[AI Act, 2024] European Parliament & Council of the European Union. (2024). Regulation (EU) 2024/1689 of the European Parliament and of the Council of 13 June 2024 laying down harmonised rules on artificial intelligence and amending Regulations (EC) No 300/2008, (EU) No 167/2013, (EU) No 168/2013, (EU) 2018/858, (EU) 2018/1139 and (EU) 2019/1020 and Directives (EU) 2015/1535 and 2017/745 (Artificial Intelligence Act). Official Journal of the European Union, L 2024/1689. https://eur-lex.europa.eu/eli/reg/2024/1689/oj
Since my first QoMEX (international conference on Quality of Multimedia Experience) in 2015 (Costa Navarino, Greece), I have considered it my conference and the attendees, my research family. It has thus become my special yearly event to connect with familiar faces and meet the next generation of researchers in the field. This edition of QoMEX has brought together an outstanding program with very interesting keynotes, technical papers and demos (see https://qomex2025.itec.aau.at/ to check the full program). Moreover, it has been especially important for me both on a professional and a personal level. I would like to summarize my subjective Experience in 4 highlights:
Figure 1. Me explaining the working principles of eating 12 grapes at midnight for New Year, while walking through Puerta del Sol.
“Introducing my home city to my research family”
Madrid is my home “town”. A couple of times during the conference, one attendee or another asked me where I was from in Spain, and I proudly answered, “I am from here”. In Madrid, I spent the first 23rd years of my life before moving abroad for my professional career. Thus, while I am not literally a local, I can be considered as such. During the conference, I had the opportunity to share my view and love of Madrid to my work family. This meant for me to introduce my research family to my early life in Madrid.
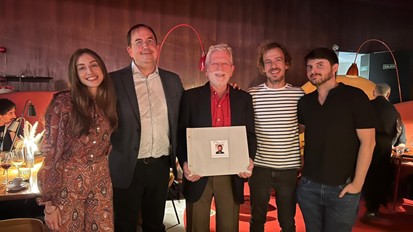
“Paying tribute to Narciso García”
Figure 2. Narciso García posing with his (former) PhD students Marta Orduna, Pablo Pérez, Jesús Gutierrez and Carlos Cortés.
QoMEX 2025 also provided the opportunity to pay well-deserved tribute to one of the two general chairs, Narciso García, on his retirement. Narciso has had an incredible impact not only on the Quality of Experience community. Moreover, plenty of researchers (including myself) in the community and beyond it consider him as a mentor and even their “spiritual guide”. Talking with Pablo Pérez (the other general co-chair) during the conference, he described Narciso as having a solution for every issue, independent from its size, complexity, or topic. Thank you Narciso for the insightful research discussions, the resourcefulness, the (history) chats, and just for being there always available for all of us.
“Mentoring the next generation of researchers”
On the final session of the conference, something very unexpected (and in my opinion very unusual) occurred. Attending the awards session is always exciting. On the one side, you are 99.9% sure that you will not get any award. However, on the other side, you always wonder “what if?”. This was definitely a “What if?” year for me. First, the Best Student Paper Award went to our work with my starting PhD student Gijs Fiten. A very interesting work on locomotion in Virtual Reality. This was also his first conference, which made it even more special (both for him and for me). When we were yet to recover from this first commotion, the Best Paper Award was announced. It went to Sam Van Damme, my former (first) PhD student on a collaborative work with CWI (Centrum Wiskunde & Informatica) in Amsterdam, about shared mental models. Details of both papers can be found in the appendix.
Seeing students that I mentored (and supervised) grow and achieve important goals in their research careers was more gratifying that winning any award myself.
“QoE researchers can easily walk in others’ shoes”
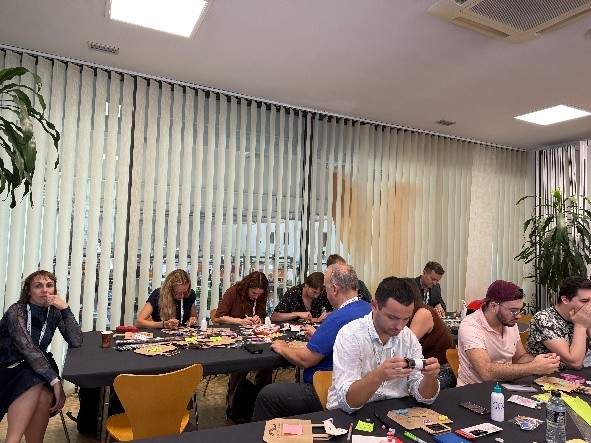
Figure 3. Reflecting our thoughts and feelings on the decoration of the bag.
To put the cherry to the cake that QoMEX 2025 was, I got the wonderful present of together with Marta Orduna (Nokia, Spain) and María Nava (Fundación Juan XXIII, Spain) to organize a diversity and inclusion workshop in the Fundación Juan XXIII (https://qomex2025.itec.aau.at/workshop/ws-walking-in-their-shoes/). It took place on Friday the 3rd of October. The Fundación (https://www.fundacionjuanxxiii.org/ ) is an organization working for more than 55 years to promote the social and labor inclusion of people in situations of psychosocial vulnerability. With the help of their workers and users, we set up a workshop where our researchers had to switch the roles. Therefore, they became the participant of a “hands-on” experience guided by people with different abilities. The activity consisted of manufacturing paper bags with the help and guidance of the experts of the Paper Lovers project (https://www.fundacionjuanxxiii.org/nuestros-proyectos).
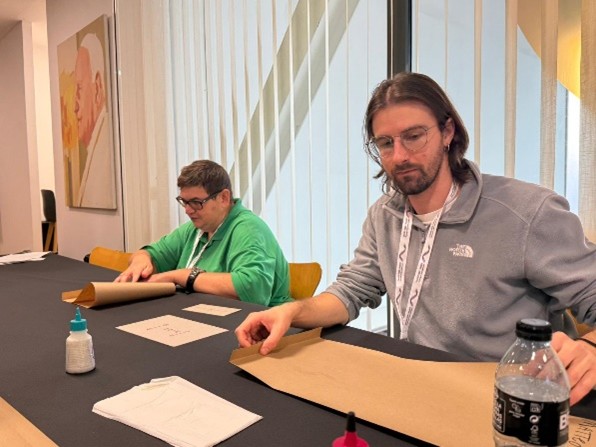
Figure 4. Santi (on the left) is teaching Matteo (on the right) to manufacture a paper bag.
There was some initial insecurity and fear of the language barrier with our Spanish teachers. However, this passed quickly and our QoE researchers adapted to the role of students and started manufacturing bags as they had been doing it for the last 5 years. After the experience, our experts rated the quality of the bags with the typical paper review grading (accept, major revision, minor revision and reject). Finally, after lunch, with the expert guidance of Elena Marquez Segura (Universidad Carlos III), we reflected on the morning session and decorated our bags to express what we had learned about researching from an inclusive perspective. All in all it was an experience session out of the usual constraints that our research imposes and a very fitting ending to a wonderful week.
Special Thanks to Gijs Fiten (KU Leuven, Belgium), Sam Van Damme (Ghent University, Belgium), Marta Orduna (Nokia XR Lab, Spain), Martín Varela (Metosin, Finland), Karan Mitra (Luleå University of Technology, Sweden), Markus Fiedler (BTH, Sweden) and of course the organizing committee of QoMEX’25 led by Pablo Pérez (Nokia XR Lab, Spain) and Narciso García (ETSIT-UPM, Spain)
Appendix. Details of the Best papers Awards at QoMEX 2025
Best
Student Paper Award
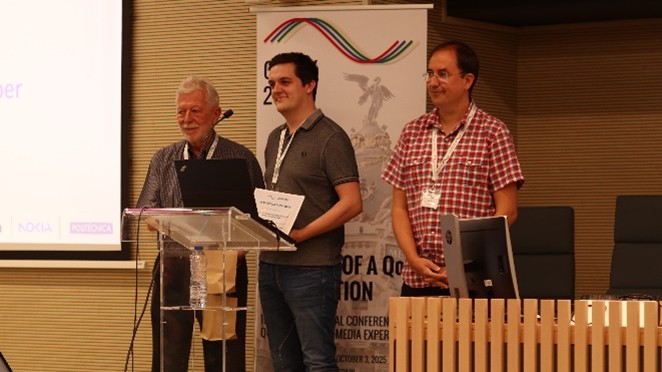
Redirected Walking for Multi-User eXtended Reality Experiences with Confined Physical Spaces G. Fiten, J. Chatterjee, K. Vanhaeren, M. Martens and M. Torres Vega 17th International Conference on Quality of Multimedia Experience (QoMEX), Madrid, Spain, 2025.
Figure 5. Gijs Fiten receiving the Best Student Paper Award.
EXtended Reality (XR)
applications allow the user to explore nearly infinite virtual worlds in a
truly immersive way. However, wandering around through these Virtual Environments (VE)s while physically
walking in reality is heavily constrained by the size of the Physical
Environment (PE). Therefore, in the last years different techniques have been
devised to improve locomotion in XR. One of these is Redirected Walking (RDW),
which aims to find a balance between immersion and PE requirements by steering
users away from the boundaries of the PE while allowing for arbitrary motion in
the VE. However, current RDW methods still require large PEs, as to avoid
obstacles and other users. Moreover, they introduce unnatural alterations in
the natural path of the user, which can trigger perception anomalies, such as
cybersickness or break of presence. These circumstances limit their usage in
real life scenarios. This paper introduces a novel RDW algorithm, with the
focus on allowing multiple users to explore an infinite VE in a confined space
(6×6 m2). To evaluate it, we designed a multi-user Virtual Reality (VR) maze
game, and benchmarked it against the state-of-the-art. A subjective study (20
participants) was conducted, where objective metrics, e.g., the path and the
speed of the user, were combined with subjective perception analysis in terms
of their cybersickness levels. Our results show that our method reduces the
appearance of cybersickness appearance in 80% of participants compared to the
state-of-the-art. These findings show the applicability of RDW to multi-user VR
with constrained environments.
Best Paper Award
From Individual QoE to Shared Mental Models: A Novel Evaluation Paradigm for Collaborative XR S. Van Damme, J. Jansen, S. Rossi and P. Cesar 17th International Conference on Quality of Multimedia Experience (QoMEX), Madrid, Spain, 2025.
Figure 6. Sam Van Damme receiving the Best Paper Award.
Extended Reality (XR) systems are
rapidly shifting from isolated, single-user applications towards collaborative
and social multi-user experiences. To evaluate the quality and effectiveness of
such interactions, it is therefore required to move beyond traditional
individual metrics such as Quality-of-Experience (QoE) or Sense of Presence
(SoP). Instead, group-level dynamics such as effective communication,
coordination etc. need to be encompassed to assess the shared understanding of
goals and procedures. In psychology, this is referred to as a Shared Mental
Model (SMM). The strength and congruence of such an SMM are known to be key for
effective team collaboration and performance. In an immersive XR setting,
though, novel Influence Factors (IFs) emerge that are not considered in a
setting of physical co-location. Evaluations on the impact of these novel
factors on SMM formation in XR, however, are close to non-existent. Therefore,
this work proposes SMMs as a novel evaluation tool for collaborative and social
XR experiences. To better understand how to explore this construct, we ran a
prototypical experiment based on
ITU recommendations in which the influence of asymmetric end-to-end latency is
evaluated through a collaborative, two-user block building task. The results
show how also in an XR context strong SMM formation can take place even when collaborators
have fundamentally different responsibilities and behavior. Moreover, the study
confirms previous findings by showing in an XR context that a teams’ SMM strength
is positively associated with its performance.
Once upon a time, when engineers measured networks in latency and packet loss, the idea of Quality of Experience (QoE) emerged — a myth whispered among researchers who dared to ask not what the system delivers, but what the user perceives. Decades later, QoE has evolved into a sprawling epic, spanning disciplines and domains, from humble MOS scores to immersive virtual realities. But as media experiences become ever more complex — adaptive, interactive, personalized — the question lingers: O QoE, where art thou?
1. Introduction
In this column, we revisit the notion of QoE and its evolution over time. We begin by reviewing early work from the 1990s to 2000s on the definitions of QoE (Section 2), where researchers first recognized the importance of user perception and the relevant QoE influence factors, as well as QoE modeling efforts. As a summary of this literature survey, QoE evolved from abstract notions of perception and satisfaction to a measurable, standardized concept encompassing the emotional, cognitive, and contextual responses of users to a service or application. The trends across time are:
1990s: Early focus on perception and interaction design.
Early 2000s: Growing focus on subjectivity, emotion, and context in user experience. QoE separated from QoS, emphasizing emotion, context, and expectation. Seen as key to commercial and user success.
Mid-2000s: Integration of technical and perceptual layers; need for metrics and quantification. Push for measurable models combining technical and user perspectives. Recognition of multiple definitions across domains.
Late 2000s–2010s: Standardization, recognition of multi-dimensionality, and development of cross-disciplinary definitions. QoE defined around subjective perception and system-wide impact.
2010s: Unified, multidisciplinary understanding established through initiatives like QUALINET; QoE as “delight or annoyance”.
This initial insight laid the foundation for larger initiatives like QUALINET, which helped to shape the field by providing widely accepted QoE definitions. We then examine how these developments have been formalized through standardization activities (Section 3), particularly within the ITU and the QUALINET whitepapers on the definition of QoE and immersive QoE.
The diverse and often conflicting definitions of QoE emerging in the 2000s highlighted the need for coordinated efforts and shared understanding across disciplines. This led to joint initiatives like QUALINET, which aimed to formalize and unify QoE research within a dedicated network. One of the results is the updated QoE definition, which is now taken in standardization.
2016: ITU-T Recommendation P.10/G.100 (2006) Amendment 5 (07/ 16), New Definitions for Inclusion in Recommendation ITU-T P.10/G.100, International Telecommunication Union, July 2016. ‘‘Quality of experience (QoE) is the degree of delight or annoyance of the user of an application or service’’.
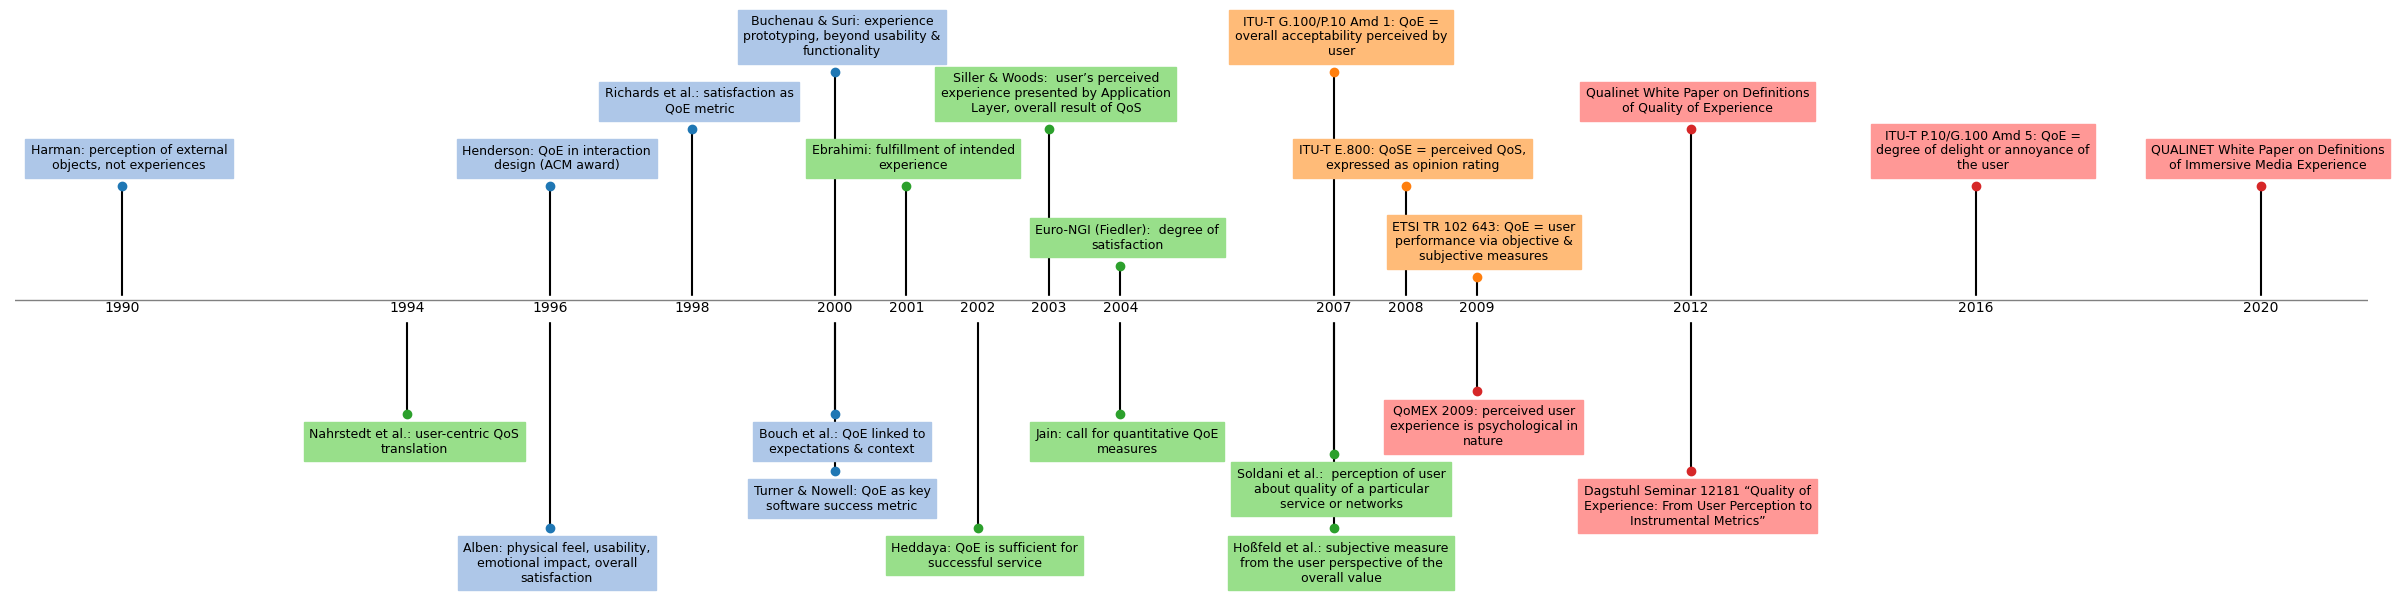
Figure 1. Timeline on the notion and definitions of QoE in literature and standardization.
A timeline of the literature survey and the early definitions of QoE as well as the standardization activities is visualized in Figure 1. Finally, we discuss selected open issues in QoE research (Section 4) that continue to challenge both academia and industry.
2. Early Definitions of QoE: 1990s to 2000s
The term Quality of Experience (QoE) emerged in the late 1990s to early 2000s as a response to the limitations of traditional network-centric approaches. Although Quality of Service (QoS) had already been formally defined in ITU-T Recommendation E.800 (1994) [ITU-T E.800] for telephony and established a basis for assessing service quality from both technical and user viewpoints, QoS primarily addresses performance at the network level. QoS is commonly applied within communication networks to describe a system’s ability to meet predefined performance targets, ensuring consistent data transmission through metrics such as bandwidth, latency, jitter, and packet loss [Varela2014].
In contrast, researchers and industry practitioners began to recognize the importance of how users actually perceive the quality of a service in the late 1990s to early 2000s. In this context, a variety of alternative terms were used prior to the standardization and definition of QoE, including User-Perceived Quality, Perceived Quality, End-User Quality, User-Experience Quality, Multimedia Experience Quality, Subjective Quality of Service, and user-level QoS. These early terms reflected a growing awareness of the need to evaluate digital services from the user’s point of view, ultimately leading to the coining and adoption of QoE as a distinct and essential concept in the field of communication systems and multimedia applications.
The term QoE brought attention to the user’s subjective perception, marking a shift toward evaluating service quality from the end-user’s perspective in the mid of 2000s. In the following, a brief overview on first documents about “Quality of Experience” or “QoE” are provided to sketch the definition of terms. In particular, research articles from the ACM Digital Library and IEEE Xplore searching for “Quality of Experience” or “QoE” are collected.
Focus on user perception and interaction design
1990: Harman, G. “The intrinsic quality of experience.“ laims we’re not directly aware of our experiences’ intrinsic properties, but of those of the external objects they represent—like color, shape, texture, motion, and spatial relations.
1996: Austin Henderson. “What’s next?” explains the idea behind the ACM Award about QoE in interaction. “We really want to know what users experience! In short we are interested in the quality of a person’s experience in the interaction. […] factors contribute to the effective experience of interacting with the device.“ However, no QoE definition is proposed.
1996: Lauralee Alben. “Quality of experience: defining the criteria for effective interaction design“ is also related to the ACM interactions design award. “By ‘experience’ we mean all the aspects of how people use an interactive product: the way it feels in their hands, how well they understand how it works, how they feel about it while they’re using it, how well it serves their purposes, and how well it fits into the entire context in which they are using it. If these experiences are successful and engaging, then they are valuable to users and noteworthy to the interaction design awards jury. We call this ‘quality of experience’.” This early definition of QoE encompasses all aspects of a user’s interaction with a product, including its physical feel, usability, emotional impact, and the overall satisfaction derived from its use.
2000: Alan Turner and Lucy T. Nowell. “Beyond the desktop: diversity and artistry” relate QoE to the need for engaging, media-rich interactions across diverse devices, emphasizing the role of artistry in delivering compelling user experiences. A remarkable statement: “We also believe that the quality of experience will become the key metric of success for software, both commercially and socially.“
Focus on subjectivity, emotion, and context
2000: Marion Buchenau and Jane Fulton Suri. “Experience prototyping.” introduce a prototyping approach that immerses users in simulated interactions to explore and refine QoE, including sensory, emotional, and contextual dimensions beyond usability or function. QoE goes beyond usability or functionality, encompassing emotional and contextual factors.
2000: Anna Bouch, Allan Kuchinsky, and Nina Bhatti. “Quality is in the eye of the beholder: meeting users’ requirements for Internet quality of service.” They show that in Internet commerce, QoE depends on both technical QoS as well as user expectations and context. “Only through such integration of users’ requirements into systems design [of users’ requirements into systems design] will it be possible to achieve the customer satisfaction that leads to the success of any commercial system.”
2001: Public slide set by Touradj Ebrahimi (2012) “Quality of Experience Past, Present and Future Trends”, presented 23 Nov 2012, refers to a definition of QoE as follows. “The degree of fulfillment of an intended experience on a given user – as defined by Touradj Ebrahimi, 2001”.
2002: Heddaya, A. S. “An economically scalable Internet” uses the term “QoE rather than quality of service because QoS is not necessary for QoE, and QoE is sufficient for successful service.”
Focus on measurable models combining technical and user perspectives
1994: Nahrstedt, K., & Smith, J., Ralf Steinmetz. “Mapping User Level QoS from a Single Parameter” aims at quantifying QoE. “The ‘satisfaction’ concept has been introduced to quantify the QoS provided by the system. The transformations required to both map the cost into satisfaction and then configure the system are then developed.”
2003: Siller, M., & Woods, J. C. “QoS arbitration for improving the QoE in multimedia transmission.” propose a QoE-aware framework that adapts QoS to real-time user perception for multimedia networks. They define QoE as “the user’s perceived experience of what is being presented by the Application Layer, where the application layer acts as a user interface front-end that presents the overall result of the individual Quality of Services”. They also review current related work at that time, which are taken from white papers, which are not accessible anymore:
“A metric used for measuring the performance of this perceptual layer is Quality of Experience (QoE).”
“QoE is referred to as; what a customer experiences and values to complete his tasks quickly and with confidence.”
“QoE is considered as all the perception elements of the network and performance relative to expectations of the users/subscribers.“
The QoE is defined as “the totality of the Quality of Service mechanisms, provided to ensure smooth transmission of audio and video over IP networks”.
2004: R. Jain. “Quality of Experience” asks the following questions. “But how do we quantitatively define the quality of experience? Can we extend QoS to QoE? What factors should we consider in developing measures for QoE?” He concludes with a remarkable statement. “In a sense, the challenges of QoE are nothing new. People in social sciences and marketing have always developed techniques to quantify people’s preferences and choices. That situation is similar to what goes into QoE.”
2004: Euro-NGI D.JRA.6.1.1 “State-of-the-art with regards to user-perceived Quality of Service and quality feedback” with Fiedler as lead for this deliverable reviews QoS from the user’s perspective. The notion of QoE is “The degree of satisfaction, i.e. the subjective quality, is influenced by the technical, objective quality stemming from the application and the interconnecting network(s). For this reason, subjective quality as perceived by the network has to be linked to objective, measurable quality, which is expressed in application and network performance parameters. “
2007: Hoßfeld, Tobias, Phuoc Tran-Gia, and Markus Fiedler. “Quantification of quality of experience for edge-based applications” provide a quantitative link between technical metrics and QoE. “Quality of Experience (QoE), a subjective measure from the user perspective of the overall value of the provided service or application”.
Diversity of definitions and interdisciplinarity
2007: Soldani, D., Li, M., & Cuny, R. “QoS and QoE management in UMTS cellular systems” define: “QoE is the term used to describe the perception of end-users on how usable the services are. […] The term ‘QoE’ refers to the perception of the user about the quality of a particular service or networks.” Notably, they already mentioned that “Browsing through the literature, one may find many different definitions for quality of end-user experience (QoE) and quality of service (QoS).”
2009: International Conference on Quality of Multimedia Experience (QoMEX) includes in the call for papers: “perceived user experience is psychological in nature and changes in different environmental conditions and with different multimedia devices.”
3. Definitions of QoE in Standardization
In standardization, the following definitions were introduced.
2007: ITU-T Rec. G.100/P.10 Amendment 1 (2007) New Appendix I – Definition of Quality of Experience (QoE). “The overall acceptability of an application or service, as perceived subjectively by the end user. NOTE 1: Quality of experience includes the complete end-to-end system effects (client, terminal, network, services infrastructure, etc.). NOTE 2: Overall acceptability may be influenced by user expectations and context.” This definition has been superseded by the Qualinet Definition of QoE in 2016. It should be mentioned that acceptance and QoE are different concepts. acceptability refers more narrowly to whether a service or system is deemed “good enough” or usable under certain conditions. Approaches to link QoE and acceptance have been discussed in literature [Schatz2011,Hossfeld2016].
2008: ITU-T Recommendation E.800. “Definitions of terms related to quality of service” defines in as follows: “quality of service experienced/perceived by customer/user (QoSE): a statement expressing the level of quality that customers/users believe they have experienced. NOTE 1: The level of QoS experienced and/or perceived by the customer/user may be expressed by an opinion rating.”
2009: ETSI TR 102 643 V1.0.1 (2009-12) “Human Factors (HF); Quality of Experience (QoE) requirements for real-time communication services” defines QoE as “measure of user performance based on both objective and subjective psychological measures of using an ICT service or product”. It includes two notes on QoE: (1) Considers technical QoS, context, and measures both communication process and outcomes (e.g. effectiveness, satisfaction). (2) Uses objective (e.g. task time, errors) and subjective (e.g. perceived quality, satisfaction) psychological measures, depending on context.
The diverse and often conflicting definitions of QoE emerging in the 2000s highlighted the need for coordinated efforts and shared understanding across disciplines. This led to joint initiatives like QUALINET, which aimed to formalize and unify QoE research within a dedicated network. One of the results is the updated QoE definition, which is now taken in standardization.
2016: ITU-T Recommendation P.10/G.100 (2006) Amendment 5 (07/ 16), New Definitions for Inclusion in Recommendation ITU-T P.10/G.100, International Telecommunication Union, July 2016: ‘‘Quality of experience (QoE) is the degree of delight or annoyance of the user of an application or service’’.
QUALINET White Paper on Definitions of Quality of Experience
QUALINET is the European Network on Quality of Experience in Multimedia Systems and Service (COST Action IC 1003 from 2010 to 2014, later a network that meets regularly at QoMEX) with the aim to “to establish a strong network on Quality of Experience (QoE) with participation from both academia and industry” (https://www.cost.eu/actions/IC1003/). QUALINET was the driving force to further advance research in the context of QoE, producing three major, well-cited assets (among others), namely (1) QUALINET White Paper on Definitions of Quality of Experience, (2) QUALINET databases [QUALINET2019], and (3) QUALINET White Paper on Definitions of Immersive Media Experience (IMEx)
The white paper on definitions of QoE was the result from a consultation and collaborative writing process within the COST Action IC 1003 of 38 authors, contributors, and editors from 18 countries. A first draft was discussed and improved at the 2012 QoE Dagstuhl Seminar [Fiedler2012]. The final definition of QoE:
“Quality of Experience (QoE) is the degree of delight or annoyance of the user of an application or service. It results from the fulfillment of his or her expectations with respect to the utility and / or enjoyment of the application or service in the light of the user’s personality and current state.”
The white paper also defines influence factors (human, system, context) and features of QoE (level of direct perception, level of interaction, level of the usage situation, level of service) as well as the relationship between QoS and QoE, plus application areas, which allow “to provide specializations of a generally agreed definition of QoE pertaining to the respective application domain taking into account its requirements formulated by means of influence factors and features of QoE”.
QUALINET White Paper on Definitions of Immersive Media Experience (IMEx)
A follow-up white paper defines the QoE for immersive media as
“the degree of delight or annoyance of the user of an application or service which involves an immersive media experience. It results from the fulfillment of his or her expectations with respect to the utility and/or enjoyment of the application or service in the light of the user’s personality and current state.”
“a high-fidelity simulation provided and communicated to the user through multiple sensory and semiotic modalities. Users are emplaced in a technology-driven environment with the possibility to actively partake and participate in the information and experiences dispensed by the generated world.”
Consequently, this white paper provides a “toolbox for definitions of IMEx including its Quality of Experience, application areas, influencing factors, and assessment methods.”[QUALINET2020].
4. Open Issues in QoE Research
We would like to conclude with some open issues regarding Quality of Experience. The upcoming 6G standard presents significant opportunities, such as QoE-aware orchestration of edge computing, cloud rendering, and network slicing [Tondwalkar2024] and native AI in 6G [Ziegler2020], while also considering tradeoff between QoE and CO2 emissions [Hossfeld2023]. As AI-generated content continues to rise, the evaluation of its quality remains in its early stages. The same applies to learning-based codecs, where existing quality assessment methods—both objective and subjective—are reaching their limits, particularly concerning media authenticity, which is becoming a critical issue. In this context, ethics and privacy are paramount, as user data plays a central role in QoE modeling. Future research must focus on privacy-preserving methods for QoE measurement and personalization. Finally, new modalities such as point clouds, light fields, and holograms necessitate the adaptation of existing techniques or the development of new methods. Moreover, multimodal or multisensory QoE, particularly concerning audio-visual-haptic or olfactory integration (previously referred to as Mulsemedia), is emerging as an important area that requires tailored QoE assessment methods and metrics. This is also reflected by the upcoming 17th Int. Conf. on Quality of Multimedia Experiences (QoMEX’25) under the theme “Thinking of a QoE ®evolultion”. In particular, the call for papers requests: “On the edge of QoMEX ‘coming of age’, it is time to rethink the purpose and methods of QoE research: cross-fertilizing with adjacent fields, reaching more diverse populations, or exploring novel techniques and paradigms.” This addresses innovative approaches and novel paradigms in QoE research, technological innovations in the era of big data data and AI, but also on user-centricity in 6G. Interdisciplinary links in QoE include diversity, ethics, accessibility, but also novel interaction techniques and multimedia experiences. Specific applications such as gaming, healthcare, education, and immersive technologies, and multisensory perception are in the scope.
And so, like any true odyssey, the search for Quality of Experience continues — not as a destination, but as a path we shape with every interaction, every pixel tuned, every user understood. QoE is no longer a myth, but neither is it fully found. It lives at the intersection of perception and precision, where engineers meet psychologists, and systems learn to listen. In a world of immersive media and intelligent networks, perhaps the better question is no longer “O QoE, where art thou?” but rather — “Are we ready to meet it where it truly resides?”
[Bouch2000]: Anna Bouch, Allan Kuchinsky, and Nina Bhatti. 2000. Quality is in the eye of the beholder: meeting users’ requirements for Internet quality of service. In Proceedings of the SIGCHI conference on Human Factors in Computing Systems (CHI ’00). Association for Computing Machinery, New York, NY, USA, 297–304. https://doi.org/10.1145/332040.332447
[Buchenau2000] Marion Buchenau and Jane Fulton Suri. 2000. Experience prototyping. In Proceedings of the 3rd conference on Designing interactive systems: processes, practices, methods, and techniques (DIS ’00). Association for Computing Machinery, New York, NY, USA, 424–433. https://doi.org/10.1145/347642.347802
[Ebrahimi2001] Public slide set by Touradj Ebrahimi (2012) “Quality of Experience Past, Present and Future Trends”, presented at Alpen-Adria-Universität Klagenfurt, 23 Nov 2012
ETSI TR 102 643 V1.0.1 (2009-12) “Human Factors (HF); Quality of Experience (QoE) requirements for real-time communication services”
[EuroNGI2004] Euro-NGI D.JRA.6.1.1 : State-of-the-art with regards to user-perceived Quality of Service and quality feedback, Deliverable version No: 1.0 Sending date: 31/05-2004, Lead: Markus Fiedler, BTH Karlskrona. <a href=”https://www.diva-portal.org/smash/get/diva2:837296/FULLTEXT01.pdf”>Last accessed: 2025/04/22</a>
[Fiedler2012] Markus Fiedler, Sebastian Möller, and Peter Reichl. Quality of Experience: From User Perception to Instrumental Metrics (Dagstuhl Seminar 12181). In Dagstuhl Reports, Volume 2, Issue 5, pp. 1-25, Schloss Dagstuhl – Leibniz-Zentrum für Informatik (2012) https://doi.org/10.4230/DagRep.2.5.1
[Hestnes2009] Hestnes, B., Brooks, P., Heiestad, S. (2009). “QoE (Quality of Experience) – measuring QoE for improving the usage of telecommunication services”, Telenor R&I R 21/2009.
[Hossfeld2007] Hoßfeld, Tobias, Phuoc Tran-Gia, and Markus Fiedler. “Quantification of quality of experience for edge-based applications.” International Teletraffic Congress. Berlin, Heidelberg: Springer Berlin Heidelberg, 2007. https://doi.org/10.1007/978-3-540-72990-7_34
[Hossfeld2016] Hoßfeld, T., Heegaard, P. E., Varela, M., & Möller, S. (2016). QoE beyond the MOS: an in-depth look at QoE via better metrics and their relation to MOS. Quality and User Experience, 1, 1-23. https://doi.org/10.1007/s41233-016-0002-1
[Hossfeld2023] Hoßfeld, T., Varela, M., Skorin-Kapov, L., & Heegaard, P. E. (2023). A Greener Experience: Trade-Offs between QoE and CO 2 Emissions in Today’s and 6G Networks. IEEE communications magazine, 61(9), 178-184. https://doi.org/10.1109/MCOM.006.2200490
[ITU-T E.800] E.800: Terms and definitions related to quality of service and network performance including dependability”. ITU-T Recommendation. August 1994. Updated September 2008 as Definitions of terms related to quality of service. Last access: 2025/04/22
[ITU-T G.100/P.10 2007] ITU-T Rec. G.100/P.10 Amendment 1 (2007) New Appendix I—Definition of Quality of Experience (QoE). International Telecommunication Union, Geneva.
[Nahrstedt1994] Nahrstedt, K., & Smith, J., Ralf Steinmetz (Ed), 1994, “Service Kernel for Multimedia Endpoints”, Multimedia: Advanced Teleservices and High-speed Communication Architectures, Lecture Notes in Computer Science LNCS868, chanter I, pp. 8-22, Springer Verlag. https://doi.org/10.1007/3-540-58494-3_2
[QUALINET2013] Patrick Le Callet, Sebastian Möller and Andrew Perkis, eds., Qualinet White Paper on Definitions of Quality of Experience (2012). European Network on Quality of Experience in Multimedia Systems and Services (COST Action IC 1003) Lausanne, Switzerland, Version 1.2, March 2013. Last access: 2025/04/22
[QUALINET2019] Karel Fliegel, Lukáš Krasula, and Werner Robitza. 2022. Qualinet databases: central resource for QoE research – history, current status, and plans. SIGMultimedia Rec. 11, 3, Article 5 (September 2019), 1 pages. https://doi.org/10.1145/3524460.3524465
[QUALINET2020] Perkis, A., Timmerer, C., et al., “QUALINET White Paper on Definitions of Immersive Media Experience (IMEx)”, European Network on Quality of Experience in Multimedia Systems and Services, 14th QUALINET meeting (online), May 25, 2020. https://arxiv.org/abs/2007.07032
[Richards1998] Richards, A., Rogers, G., Witana, V., & Antoniades, M., 1998, “Mapping User Level QoS from a Single Parameter”, In Proceedings of the International Conference on MultimediaNetworks and Services (MMNS ‘98).
[Schatz2011] Schatz, R., Egger, S., & Platzer, A. (2011, June). Poor, good enough or even better? bridging the gap between acceptability and qoe of mobile broadband data services. In 2011 IEEE International Conference on Communications (ICC) (pp. 1-6). IEEE. https://doi.org/10.1109/icc.2011.5963220
[Siller2003] Siller, M., & Woods, J. C. (2003, July). QoS arbitration for improving the QoE in multimedia transmission. In International Conference on Visual Information Engineering (VIE 2003). Ideas, Applications, Experience (pp. 238-241). London UK: IEE. https://doi.org/10.1049/cp:20030531
[Tondwalkar2024] Tondwalkar, A., Andres-Maldonado, P., Chandramouli, D., Liebhart, R., Moya, F. S., Kolding, T., & Perez, P. (2024). Provisioning Quality of Experience in 6G Networks. IEEE Access. https://doi.org/10.1109/ACCESS.2024.3455938
[Turner2000] Alan Turner and Lucy T. Nowell. 2000. Beyond the desktop: diversity and artistry. In CHI ’00 Extended Abstracts on Human Factors in Computing Systems (CHI EA ’00). Association for Computing Machinery, New York, NY, USA, 35–36. https://doi.org/10.1145/633292.633317
[Varela2014] Varela, M., Skorin-Kapov, L., & Ebrahimi, T. (2014). Quality of service versus quality of experience. In Quality of Experience: Advanced Concepts, Applications and Methods (pp. 85-96). Cham: Springer International Publishing. https://doi.org/10.1007/978-3-319-02681-7_6
Immersive imaging technologies offer a transformative way to change how we experience interacting with remote environments, i.e., telepresence. By leveraging advancements in light field imaging, omnidirectional cameras, and head-mounted displays, these systems enable realistic, real-time visual experiences that can revolutionize how we interact with the remote scene in fields such as healthcare, education, remote collaboration, and entertainment. However, the field faces significant technical and experiential challenges, including efficient data capture and compression, real-time rendering, and quality of experience (QoE) assessment. Expanding on the findings of the authors’ recent publication and situating them within a broader theoretical framework, this article provides an integrated overview of immersive telepresence technologies, focusing on their technological foundations, applications, and the challenges that must be addressed to advance this field.
1. Redefining Telepresence Through Immersive Imaging
Telepresence is defined as the “sense of being physically present at a remote location through interaction with the system’s human interface” [Minsky1980]. Such virtual presence is made possible by digital imaging systems and real-time communication of visuals and interaction signals. Immersive imaging systems such as light fields and omnidirectional imaging enhance the visual sense of presence, i.e., “being there” [IJsselsteijn2000], with photorealistic recreation of the remote scene. This emerging field has seen rapid growth, both in research and development [Valenzise2022], due to advancements in imaging and display technologies, combined with increasing demand for interactive and immersive experiences. A visualization is provided in Figure 1 that shows a telepresence system that utilizes traditional cameras and controls and an immersive telepresence system.
Figure 1 – A side-by-side visualization of a traditional telepresence system (left) and an immersive telepresence system (right).
The experience of “presence” consists of three components according to Schubert et al. [Schubert2001], which are renamed in this article to take into account other definitions:
Realness – “Realness” [Schubert2001] or “realism” [Takatalo2008] of the environment (i.e., in this case, the remote scene) relates to the “believability, the fidelity and validity of sensory features within the generated environments, e.g., photorealism.” [Perkis 2020].
Immersion – User’s level of “involvement” [Schubert2001] and “concentration to the virtual environment instead of real world, loss of time” [Takatalo2008]. “The combination of sensory cues with symbolic cues essential for user emplacement and engagement” [Perkis2020].
Spatiality – An attribute of the environment helps “transporting” the user to induce spatial awareness [Schubert2001] which allows “spatial presence” [Takatalo2008] and “the possibility for users to move freely and discover the world offered” [Perkis2020].
Immersion can happen without having realness or spatiality, for example, while we are reading a novel. Telepresence using traditional imaging systems might not be immersive in case of a relatively small display and other distractors present in the visual field. Realistic immersive telepresence necessitates higher degrees of freedom (e.g., 3 DoF+ or 6DoF) compared to a telepresence application with a traditional display. In this context, new view synthesis methods and spherical light field representations (cf. Section 3) will be crucial in giving correct depth cues and depth perception – which will increase realness and spatiality tremendously.
The rapid progress of immersive imaging technologies and their adoption can largely be attributed to advancements in processing and display systems, including light field displays and extended reality (XR) headsets. These XR headsets are becoming increasingly affordable while delivering excellent user experiences [Jackson2023], paving the way for the widespread adoption of immersive communication and telepresence applications in the near future. To further accelerate this transition, extensive efforts are being undertaken in both academia as well as industry.
The visual realism (i.e., realness) in realistic immersive telepresence relies on acquired photos rather than computer-generated imagery (CGI). In healthcare, it enables realistic remote consultations and surgical collaborations [Wisotzky2025]. In education and training, it facilitates immersive, location-independent learning environments [Kachach2021]. Similarly, visual realism can enhance remote collaboration by creating lifelike meeting spaces, while in media and entertainment, it can provide unprecedented realism for live events and performances, offering users a closer connection and having a feeling of being present on remote sites.
This article provides a brief overview of the technological foundations, applications, and challenges in immersive telepresence. The novel contribution of this article is setting up the theoretical framework for realistic immersive telepresence informed by prior literature and positioning the findings of the author’s recent publication [Zerman2024] within this broader theoretical framework. It explores how foundational technologies like light field imaging and real-time rendering drive the field forward, while also identifying critical obstacles, such as dataset availability, compression efficiency, and QoE evaluation.
2. Technological Foundations for Immersive Telepresence
A realistic immersive telepresence can be made possible by enabling its main defining factors of realness (e.g., photorealism), immersion, and spatiality. Although these factors can be satisfied with other modalities (e.g., spatial audio), this article focuses on the visual modality and visual recreation of the remote scene.
2.1 Immersive Imaging Modalities
Immersive imaging technologies encompass a wide range of methods aimed at capturing and recreating realistic visual and spatial experiences. These include light fields, omnidirectional images, volumetric videos using either point clouds or 3D meshes, holography, multi-view stereo imaging, neural radiance fields, Gaussian splats, and other extended reality (XR) applications — all of which contribute to recreating highly realistic and interactive representations of scenes and environments.
Light fields (LF) are vector fields of all the light rays passing through a given region in space, describing the intensity and direction of light at every point. This is fully described through the plenoptic function [Adelson1991] as follows: P(x,y,z,θ,ϕ,λ,t), where x, y, and z describe the 3D position of sampling, θ and ϕ are the angular direction, λ is the wavelength of the light ray, and t is time. Traditionally, LFs are represented using the two-plane parametrization [Levoy1996] with 2 spatial dimensions and 2 angular dimensions; however, this parametrization limits the use case of LFs to processing planar visual stimuli. The plenoptic function can be leveraged beyond the two-plane parameterization for a highly detailed view reconstruction or view synthesis. Newer capture scenarios and representations enable increased immersion with LFs [Overbeck2018],[Broxton2020], which can be further advanced in the future.
Omnidirectional image (or video) representation can provide an all-encompassing 360-degree view of a scene from a point in space for immersive visualization [Yagi1999], [Maugey2023]. This is made possible by stitching multiple views together. The created spherical image can be stored using traditional image formats (i.e., 2D planar formats) by projecting the sphere to planar format (e.g., equirectangular projection, cubemap projection, and others); however, processing these special representations without proper consideration for their spherical nature results in errors or biases.
2.2 Processing Requirements for Realistic Immersive Telepresence
Immersive telepresence relies on capturing, transmitting, and rendering realistic representations of remote environments. “Capturing” can be considered an inherent part of the imaging modalities discussed in the previous section. For transmitting and rendering, there are different requirements to take into account.
Compression is an important step for telepresence that relies heavily on real-time transmission of the visual data from the remote scene. The importance of compression increases even more for immersive telepresence applications as immersive imaging modalities capture (and represent) more information and need even more compression compared to the telepresence using traditional 2D imaging systems. Compression of LFs [Stepanov2023], omnidirectional images and video [Croci2020], and other forms of immersive video such as MPEG Immersive Video [Boyce2021], volumetric 3D representations represented with point clouds [Graziosi2020], and textured 3D meshes [Marvie2022] have been a very hot research topic within the last decade, which led to the standardization of compression methods for some immersive imaging modalities.
Rendering [Eisert2023], [Maugey2023] is yet another important aspect, especially for LFs [Overbeck2018]. The LF data needs to be rendered correctly for the position of the viewer (i.e., to render interpolated or extrapolated views) to provide a realistic and immersive experience to the user. Without the view rendering (i.e., for interpolation or extrapolation), the final displayed visuals will appear jittery, which will make the experience harder to sustain the necessary “suspension of disbelief” for an immersive experience. Furthermore, this rendering has to be real-time, as it is a requirement for telepresence. Although technologies such as GPU acceleration and advanced compression algorithms ensure seamless interaction while minimizing latency, the quality and the realness of the remote scene are still to be solved.
Immersive telepresence systems rely on specialized hardware, including omnidirectional cameras, head-mounted displays, and motion tracking systems. These components must work in harmony to deliver high-quality, immersive experiences. Reducing prices and increasing availability of such specialized devices make them easier to deploy in industrial settings [Jackson2023] regardless of business size and enables the democratization of immersive imaging applications in a broader sense.
3. Efforts in Creating a Realistic Immersive Telepresence Experience
Creating an immersive telepresence system has been a topic of many scholarly studies. These include frameworks for group-to-group telepresence [Beck2013], creating capture and delivery frameworks for volumetric 3D models [Fechteler2013], and various other social XR applications [Cortés2024]. Google’s project Starline can also be mentioned here to include realness and immersion in its delivery of the visuals, creating an immersive experience [Lawrence2024], [Starline2025], although its main functionality is interpersonal video communication. In supporting realness, LFs [Broxton2020] and other types of neural representations [Suhail2022] can create views that can support reflections and similar non-Lambertian light material interactions in recreating light occurring in the remote scene, whereas the usual assumption for texturing reconstructed 3D objects is to assume Lambertian materials [Zhi2020].
Light field reconstruction [Gond2023] and new view synthesis from single-view [Lin2023] or sparse views [Chibane2021] can be a valid way to approach creating realistic immersive telepresence experiences. Various representations can be used to recreate various views that would support movement of the user and the spatial awareness factor of presence in the remote scene. These representations can be Multi-Planar Image (MPI) [Srinivasan2019], Multi-Cylinder Image (MCI) [Waidhofer2022], layered mesh representation [Broxton2020], and neural representations [Chibane2021], [Lin2023], [Gond 2023] – which rely on structured or unstructured 2D image captures of the remote scene.
Another way of creating a realistic immersive experience can be by combining the different imaging modalities – i.e., omnidirectional content and light fields – in the form of spherical light fields (SLFs). SLFs then enable rendering and view synthesis that can generate more realistic and immersive content. There have been various attempts to create SLFs by collecting linear captures vertically [Krolla2014], capturing omnidirectional content from the scene with multiple cameras [Maugey2019], and moving a single camera in a circular trajectory and utilizing deep neural networks to generate an image grid [Lo2023]. Nevertheless, these works either did not yield publicly available datasets or did not have precise localizations of the cameras. To address this, the Spherical Light Field Database (SLFDB) was introduced in previous work [Zerman2024], which provides a foundational dataset for testing and developing applications for realistic immersive telepresence applications.
4. Challenges and Limitations
Studies in creating realistic immersive telepresence environments showed that there are still certain challenges and limitations that need to be addressed to improve QoE and IMEx for these systems. These challenges include dataset availability, compression of the structured and unstructured LFs, new view synthesis and rendering, and QoE estimation. Most of these challenges are also discussed in our recent study [Zerman2024].
Figure 2 – A set of captures highlighting the effects of dynamically changing scene: lighting change and its effect on white balance (top) and dynamic capture environment, where people appear and disappear (bottom).
Datasets relevant to realistic immersive telepresence tasks, such as the SLFDB [Zerman2024], are crucial for developing and validating immersive telepresence technologies. However, the creation and use of such datasets with precise spatial and angular resolution and very precise positioning of the camera face significant hurdles. Traditional camera grid setups are ineffective for capturing spherical light fields due to occlusions. This challenge necessitates having static scenes and meticulous camera positioning for a consistent capture of the scene. A dynamic scene brings a risk of non-consistent views within the same light field, as shown in Figure 2, which is non-ideal. These challenges highlight the critical need for innovative approaches to spherical light field dataset generation and sharing, ensuring future advancements in the field. Additionally, variations in lighting present significant challenges when capturing spherical light fields, as they impact the scene’s dynamic range, white balance, and color grading, which creates yet another challenge in database creation. Brightness and color variations, such as sunlight’s yellow tint compared to cloudy daylight, are not easy to correct and often require advanced algorithms for adjustment. Capturing static outdoor scenes remains a challenge for future work, as they still encounter lighting-related issues despite lacking movement.
LF compression is also another challenge that requires attention after combining imaging modalities. JPEG Pleno compression algorithm [ISO2021] is adapted for 2-dimensional grid-like structured LFs (e.g., LFs captured by microlens array or structured camera grids) and does not work for linear or unstructured captures. The situation is the same for many other compression methods, as most of them require some form of structured representation. Considering how well scene regression and other new view synthesis algorithms can adapt for unstructured inputs, one can also see the importance of advancing the compression field for unstructured LFs (e.g., the volume of light captured by cameras in various positions or in-the-wild user captures). Furthermore, the said LF compression method needs to be real-time to support immersive telepresence applications while having a very good visual QoE that would not impede realism.
Figure 3 – Strong artifacts created at the extremes of view synthesis with a large baseline (i.e. 30cm), where either the scene is warped (left – 360ViewSynth), or strong ghosting artifacts occur (right – PanoSynthVR).
Current new view synthesis methods are primarily designed to handle small baselines, typically just a few centimeters, and face significant challenges when applied to larger baselines required in telepresence applications. Challenges such as ghosting artifacts and unrealistic distortions (e.g., nonlinear distortions, stretching) occur when interpolating views, particularly for larger baselines, as shown in Figure 3. A recent comparative evaluation of PanoSynthVR and 360ViewSynth [Zerman2024] reveals that while 360ViewSynth marginally outperforms PanoSynthVR on average quality metrics, the scores for both methods remain suboptimal. PanoSynthVR struggles with large baselines, exhibiting prominent layer-like ghosting artifacts due to limitations in its MCI structure. Although 360ViewSynth produces visually better results, closer inspection shows that it distorts object perspectives by stretching them rather than accurately rendering the scene, leading to an unnatural user experience. These findings underscore the limitations of current state-of-the-art view synthesis methods for SLFs and highlight the complexity of addressing larger baselines effectively in view synthesis.
Assessing user satisfaction and immersion in telepresence systems is a multidimensional challenge, requiring assessments in three different strands as described in IMEx whitepaper: subjective assessment, behavioral assessment, and assessment via psycho-physiological methods [Perkis2020]. Quantitative metrics can be used for interaction latency and task performance metrics in a user study, and individual preferences and experiences can be collected qualitatively. Certain aspects of user experience, such as visual quality and user engagement, can also be collected as quantitative data during user studies – with user self-reporting. Additionally, behavioral assessment (e.g., user movement, interaction patterns) can be used to identify different use patterns. Here, the limiting factor is mainly the time and experience cost in running the said user studies. Therefore, the challenge here is to prepare a framework that can model the user experience for realistic immersive telepresence scenarios, which can speed up the assessment strategies.
Other limitations and aspects to consider include accessibility, privacy issues, and ethics. Regarding accessibility, it is important to ensure that immersive telepresence technologies are affordable and usable by diverse populations. The situation is improving as the cameras and headsets are getting cheaper and easier to use (e.g., faster and stronger on-device processing, removal of headset connection cables, increased ease of use with hand gestures, etc.). Nevertheless, hardware costs, connectivity requirements, and usability barriers must be further addressed to make these systems widely accessible. Regarding privacy and ethics, the realistic nature of immersive telepresence may raise ethical and privacy concerns. Capturing and transmitting live environments may involve sensitive data, necessitating robust privacy safeguards and ethical guidelines to prevent misuse. Also, privacy concerns regarding the headsets that rely on visual cameras for localization and mapping must be addressed.
5. Conclusions and Future Directions
Realistic immersive telepresence systems represent a transformative shift in how people interact with remote environments. By combining advanced imaging, rendering, and interaction technologies, these systems promise to revolutionize industries ranging from healthcare to entertainment. However, significant challenges remain, including data availability, compression, rendering, and QoE assessment. Addressing these obstacles will require collaboration across disciplines and industries.
To address these challenges, future research should focus on attempting to create relevant datasets for spherical LFs that address with accurate positioning of the camera and challenges such as dynamic lighting conditions and occlusions. Developing real-time, robust compression methods for unstructured LFs, which maintain visual quality and support immersive applications, is another critical area. Developing advanced view synthesis algorithms capable of handling large baselines without introducing artifacts or distortions and creating frameworks for user experience and QoE assessment methodologies are still open research questions.
Further into the future, the remaining challenges can be solved using learning-based algorithms for the challenges related to realness and spatiality factors as well as QoE estimation, increasing the level of interactivity and feeling of immersion through integrating different senses to the existing systems (e.g., spatial audio, haptics, natural interfaces), and increasing the standardization to create common frameworks that can manage interoperability across different systems. Long-term goals include the integration of realistic immersive displays – such as LF displays or improved holographic displays – and the convergence of telepresence systems with emerging technologies like 5G or 6G networks and edge computing, on which the efforts are already underway [Mahmoud2023].
References
[Adelson1991] Adelson, E. H., & Bergen, J. R. (1991). The plenoptic function and the elements of early vision (Vol. 2). Cambridge, MA, USA: Vision and Modeling Group, Media Laboratory, Massachusetts Institute of Technology.
[Beck2013] Beck, S., Kunert, A., Kulik, A., & Froehlich, B. (2013). Immersive group-to-group telepresence. IEEE transactions on visualization and computer graphics, 19(4), 616-625.
[Boyce2021] Boyce, J. M., Doré, R., Dziembowski, A., Fleureau, J., Jung, J., Kroon, B., … & Yu, L. (2021). MPEG immersive video coding standard. Proceedings of the IEEE, 109(9), 1521-1536.
[Broxton2020] Broxton, M., Flynn, J., Overbeck, R., Erickson, D., Hedman, P., Duvall, M., … & Debevec, P. (2020). Immersive light field video with a layered mesh representation. ACM Transactions on Graphics (TOG), 39(4), 86-1.
[Chibane2021] Chibane, J., Bansal, A., Lazova, V., & Pons-Moll, G. (2021). Stereo radiance fields (SRF): Learning view synthesis for sparse views of novel scenes. In Proceedings of the IEEE/CVF Conference on Computer Vision and Pattern Recognition (pp. 7911-7920).
[Cortés2024] Cortés, C., Pérez, P., & García, N. (2023). Understanding latency and qoe in social xr. IEEE Consumer Electronics Magazine.
[Croci2020] Croci, S., Ozcinar, C., Zerman, E., Knorr, S., Cabrera, J., & Smolic, A. (2020). Visual attention-aware quality estimation framework for omnidirectional video using spherical Voronoi diagram. Quality and User Experience, 5, 1-17.
[Eisert2023] Eisert, P., Schreer, O., Feldmann, I., Hellge, C., & Hilsmann, A. (2023). Volumetric video– acquisition, interaction, streaming and rendering. In Immersive Video Technologies (pp. 289-326). Academic Press.
[Fechteler2013] Fechteler, P., Hilsmann, A., Eisert, P., Broeck, S. V., Stevens, C., Wall, J., … & Zahariadis, T. (2013, June). A framework for realistic 3D tele-immersion. In Proceedings of the 6th International Conference on Computer Vision/Computer Graphics Collaboration Techniques and Applications.
[Gond2023] Gond, M., Zerman, E., Knorr, S., & Sjöström, M. (2023, November). LFSphereNet: Real Time Spherical Light Field Reconstruction from a Single Omnidirectional Image. In Proceedings of the 20th ACM SIGGRAPH European Conference on Visual Media Production (pp. 1-10).
[Graziosi2020] Graziosi, D., Nakagami, O., Kuma, S., Zaghetto, A., Suzuki, T., & Tabatabai, A. (2020). An overview of ongoing point cloud compression standardization activities: Video-based (V-PCC) and geometry-based (G-PCC). APSIPA Transactions on Signal and Information Processing, 9, e13.
[IJsselsteijn2000] IJsselsteijn, W. A., De Ridder, H., Freeman, J., & Avons, S. E. (2000, June). Presence: concept, determinants, and measurement. In Human Vision and Electronic Imaging V (Vol. 3959, pp. 520-529). SPIE.
[ISO2021] ISO/IEC 21794-2:2021 (2021) Information technology – Plenoptic image coding system (JPEG Pleno) — Part 2: Light field coding.
[Jackson2023] Jackson, A. (2023, September) Meta Quest 3: Can businesses use VR day-to-day?, Technology Magazine. https://technologymagazine.com/digital-transformation/meta-quest-3-can-businesses-use-vr-day- to-day, Accessed: 2024-02-05.
[Kachach2021] Kachach, R., Orduna, M., Rodríguez, J., Pérez, P., Villegas, Á., Cabrera, J., & García, N. (2021, July). Immersive telepresence in remote education. In Proceedings of the International Workshop on Immersive Mixed and Virtual Environment Systems (MMVE’21) (pp. 21-24).
[Krolla2014] Krolla, B., Diebold, M., Goldlücke, B., & Stricker, D. (2014, September). Spherical Light Fields. In BMVC (No. 67.1–67.12).
[Lawrence2024] Lawrence, J., Overbeck, R., Prives, T., Fortes, T., Roth, N., & Newman, B. (2024). Project starline: A high-fidelity telepresence system. In ACM SIGGRAPH 2024 Emerging Technologies (pp. 1-2).
[Levoy1996] Levoy, M. & Hanrahan, P. (1996) Light field rendering, in Proceedings of the 23rd Annual Conference on Computer Graphics and Interactive Techniques (pp. 31-42), New York, NY, USA, Association for Computing Machinery.
[Lin2023] Lin, K. E., Lin, Y. C., Lai, W. S., Lin, T. Y., Shih, Y. C., & Ramamoorthi, R. (2023). Vision transformer for nerf-based view synthesis from a single input image. In Proceedings of the IEEE/CVF Winter Conference on Applications of Computer Vision (pp. 806-815).
[Lo2023] Lo, I. C., & Chen, H. H. (2023). Acquiring 360° Light Field by a Moving Dual-Fisheye Camera. IEEE Transactions on Image Processing.
[Mahmoud2023] Mahmood, A., Abedin, S. F., O’Nils, M., Bergman, M., & Gidlund, M. (2023). Remote-timber: an outlook for teleoperated forestry with first 5g measurements. IEEE Industrial Electronics Magazine, 17(3), 42-53.
[Marvie2022] Marvie, J. E., Krivokuća, M., Guede, C., Ricard, J., Mocquard, O., & Tariolle, F. L. (2022, September). Compression of time-varying textured meshes using patch tiling and image-based tracking. In 2022 10th European Workshop on Visual Information Processing (EUVIP) (pp. 1-6). IEEE.
[Maugey2019] Maugey, T., Guillo, L., & Cam, C. L. (2019, June). FTV360: A multiview 360° video dataset with calibration parameters. In Proceedings of the 10th ACM Multimedia Systems Conference (pp. 291-295).
[Maugey2023] Maugey, T. (2023). Acquisition, representation, and rendering of omnidirectional videos. In Immersive Video Technologies (pp. 27-48). Academic Press. [Minsky1980] Minsky, M. (1980). Telepresence. Omni, pp. 45-51.
[Overbeck2018] Overbeck, R. S., Erickson, D., Evangelakos, D., Pharr, M., & Debevec, P. (2018). A system for acquiring, processing, and rendering panoramic light field stills for virtual reality. ACM Transactions on Graphics (TOG), 37(6), 1-15.
[Perkis2020] Perkis, A., Timmerer, C., et al. (2020, May) “QUALINET White Paper on Definitions of Immersive Media Experience (IMEx)”, European Network on Quality of Experience in Multimedia Systems and Services, 14th QUALINET meeting (online), Online: https://arxiv.org/abs/2007.07032
[Schubert2001] Schubert, T., Friedmann, F., & Regenbrecht, H. (2001). The experience of presence: Factor analytic insights. Presence: Teleoperators & Virtual Environments, 10(3), 266-281.
[Srinivasan2019] Srinivasan, P. P., Tucker, R., Barron, J. T., Ramamoorthi, R., Ng, R., & Snavely, N. (2019). Pushing the boundaries of view extrapolation with multiplane images. In Proceedings of the IEEE/CVF Conference on Computer Vision and Pattern Recognition (pp. 175-184).
[Starline2025]Project Starline: Be there from anywhere with our breakthrough communication technology. (n.d.). Online: https://starline.google/. Accessed: 2025-01-14
[Stepanov2023] Stepanov, M., Valenzise, G., & Dufaux, F. (2023). Compression of light fields. In Immersive Video Technologies (pp. 201-226). Academic Press.
[Suhail2022] Suhail, M., Esteves, C., Sigal, L., & Makadia, A. (2022). Light field neural rendering. In Proceedings of the IEEE/CVF Conference on Computer Vision and Pattern Recognition (pp. 8269-8279).
[Takatalo2008] Takatalo, J., Nyman, G., & Laaksonen, L. (2008). Components of human experience in virtual environments. Computers in Human Behavior, 24(1), 1-15.
[Valenzise2022] Valenzise, G., Alain, M., Zerman, E., & Ozcinar, C. (Eds.). (2022). Immersive Video Technologies. Academic Press.
[Waidhofer2022] Waidhofer, J., Gadgil, R., Dickson, A., Zollmann, S., & Ventura, J. (2022, October). PanoSynthVR: Toward light-weight 360-degree view synthesis from a single panoramic input. In 2022 IEEE International Symposium on Mixed and Augmented Reality (ISMAR) (pp. 584-592). IEEE.
[Wisotzky2025] Wisotzky, E. L., Rosenthal, J. C., Meij, S., van den Dobblesteen, J., Arens, P., Hilsmann, A., … & Schneider, A. (2025). Telepresence for surgical assistance and training using eXtended reality during and after pandemic periods. Journal of telemedicine and telecare, 31(1), 14-28.
[Yagi1999] Yagi, Y. (1999). Omnidirectional sensing and its applications. IEICE transactions on information and systems, 82(3), 568-579.
[Zerman2024] Zerman, E., Gond, M., Takhtardeshir, S., Olsson, R., & Sjöström, M. (2024, June). A Spherical Light Field Database for Immersive Telecommunication and Telepresence Applications. In 2024 16th International Conference on Quality of Multimedia Experience (QoMEX) (pp. 200-206). IEEE.
[Zhi2020] Zhi, T., Lassner, C., Tung, T., Stoll, C., Narasimhan, S. G., & Vo, M. (2020). TexMesh: Reconstructing detailed human texture and geometry from RGB-D video. In Computer Vision–ECCV 2020: 16th European Conference, Glasgow, UK, August 23–28, 2020, Proceedings, Part X 16 (pp. 492-509). Springer International Publishing.
Service and network providers actively evaluate and derive Quality of Experience (QoE) metrics within their systems, which necessitates suitable monitoring strategies. Objective QoE monitoring involves mapping Quality of Service (QoS) parameters into QoE scores, such as calculating Mean Opinion Scores (MOS) or Good-or-Better (GoB) ratios, by using appropriate mapping functions. Alternatively, individual QoE monitoring directly assesses user experience based on self-reported feedback. We discuss the strengths, weaknesses, opportunities, and threats of both approaches. Based on the collected data from individual or objective QoE monitoring, providers can calculate the QoE metrics across all users in the system, who are subjected to a range of varying QoS conditions. The aggregated QoE across all users in the system for a dedicated time frame is referred to as system QoE. Based on a comprehensive simulation study, the expected system QoE, the system GoB ratio, as well as QoE fairness across all users are computed. Our numerical results explore whether objective and individual QoE monitoring lead to similar conclusions. In our previous work [Hoss2024], we provided a theoretical framework and the mathematical derivation of the corresponding relationships between QoS and system QoE for both monitoring approaches. Here, the focus is on illustrating the key differences of individual and objective QoE monitoring and the consequences in practice.
System QoE: Assessment of QoE of Users in a System
The term “System QoE” refers to the assessment of user experience from a provider’s perspective, focusing on the perceived quality of the users of a particular service. Thereby, providers may be different stakeholders along the service delivery chain, for example, network service provider and, in particular, Internet service provider, or application service provider. QoE monitoring delivers the necessary information to evaluate the system QoE, which is the basis for appropriate actions to ensure high-quality services and high QoE, e.g., through resource and network management.
Typically, QoE monitoring and management involves
evaluating how well the network and services perform by analyzing objective
metrics like Quality of Service (QoS) parameters (e.g., latency, jitter, packet
loss) and mapping them to QoE metrics, such as Mean Opinion Scores (MOS). However,
QoE monitoring involves a series of steps that providers need to follow: 1) identify
relevant QoE metrics of interest, like MOS or GoB ratio; 2) deploy a monitoring
framework to collect and analyze data. We will discuss this in the following.
The scope of system QoE metrics is to quantify the QoE across all users consuming the service for a dedicated time frame, e.g., one day, one week, or one month. Thereby, the expected QoE of an arbitrary user in the system, the ratio of all users experiencing Good-or-Getter (GoB) quality or Poor-or-Worse (PoW) quality, as well as the QoE fairness across all users are of interest. The users in the system may achieve different QoS on network level, e.g., different latency, jitter, throughput, since resources are shared among the users. The same is also true on application level with varying application-specific QoS parameters, for instance, video resolution, buffering time, or startup delays for video streaming. The varying QoS conditions manifest then in the system QoE. Fundamental relationships between the system QoE and QoS metrics were derived in [Hoss2020].
Expected system QoE: The expected system QoE is the average QoE rating of an arbitrary user in the system. The fundamental relationship in [Hoss2020] shows that the expected system QoE may be derived by mapping the QoS as experienced by a user to the corresponding MOS value and computing the average MOS over the varying QoS conditions. Thus, a MOS mapping function is required to map the QoS parameters to MOS values.
System GoB and System PoW: The Mean Opinion Score provides an average score but fails to account for the variability in users and the user rating diversity. Thus, users obtaining the same QoS conditions, may rate this subjectively differently. Metrics like the percentage of users rating the experience as Good or Better or as Poor or Worse provide more granular insights. Such metrics help service providers understand not just the average quality, but how quality is distributed across the user base. The fundamental relationship in [Hoss2020] shows that the system GoB and PoW may be derived by mapping the QoS as experienced by a user to the corresponding GoB or PoW value and computing the average over the varying QoS conditions, respectively. Thus, a GoB or PoW mapping function is required.
QoE Fairness: Operators must not only ensure that users are sufficiently satisfied, but also that this is done in a fair manner. However, what is considered fair in the QoS domain may not necessarily translate to fairness in the QoE domain, making the need to apply a QoE fairness index. [Hoss2018] defines the QoE fairness index as a linear transformation of the standard deviation of MOS values to the range [0;1]. The observed standard deviation is normalized with the maximal standard deviation, being theoretically possible for MOS values in a finite range, typically between 1 (poor quality) and 5 (excellent quality). The difference between 1 (indicating perfect fairness) and the normalized standard deviation of MOS values (indicating the degree of unfairness) yields the fairness index.
The fundamental relationships allow different implementations of QoE monitoring in practice, which are visualized in Figure 1 and discussed in the following. We differentiate between individual QoE monitoring and objective QoE monitoring and provide a qualitative strengths-weaknesses-opportunities-threats (SWOT) analysis.
Figure 1. QoE monitoring approaches to assess system QoE: individual and objective QoE monitoring.
Individual QoE Monitoring
Individual QoE monitoring refers to the assessment of system QoE by collecting individual ratings, e.g., on a 5-point rating scale, from users through their personal feedback. This approach captures the unique and individual nature of user experiences, accounting for factors like personal preferences and context. It allows optimizing services in a personalized manner, which is regarded as a challenging future research objective, see [Schmitt2017, Zhu2018, Gao2020, Yamazaki2021, Skorin-Kapov2018].
The term “individual QoE” was nicely described by in [Zhu2018]: “QoE, by definition, is supposed to be subjective and individual. However, we use the term ‘individual QoE’, since the majority of the literature on QoE has not treated it as such. […] The challenge is that the set of individual factors upon which an individual’s QoE depends is not fixed; rather this (sub)set varies from one context to another, and it is this what justifies even more emphatically the individuality and uniqueness of a user’s experience – hence the term ‘individual QoE’.”
Strengths:
Individual QoE monitoring provides valuable
insights into how users personally experience a service, capturing the
variability and uniqueness of individual perceptions that objective metrics
often miss. A key strength is that it gathers direct feedback from a provider’s
own users, ensuring a representative sample rather than relying on external or
unrepresentative populations. Additionally, it does not require a predefined
QoE model, allowing for flexibility in assessing user satisfaction. This approach
enables service providers to directly derive various system QoE metrics.
Weaknesses:
Individual QoE monitoring is mainly feasible for
application service providers and requires additional monitoring efforts beyond
the typical QoS tools already in place. Privacy concerns are significant, as
collecting sensitive user data can raise issues with data protection and
regulatory compliance, such as with GDPR. Additionally, users may use the
system primarily as a complaint tool, focusing on reporting negative
experiences, which could skew results. Feedback fatigue is another challenge,
where users may become less willing to provide ongoing input over time,
limiting the validity and reliability of the data collected.
Opportunities: Data from individual QoE monitoring can be utilized to enhance
individual user QoE through better resource and service management. From a
business perspective, offering a personalized QoE can set providers apart in
competitive markets and the data collected has monetization potential,
supporting personalized marketing. Data from individual QoE monitoring enables
deriving objective metrics like MOS or GoB, to update existing QoE models or to
develop new QoE models for novel services by correlating it with QoS parameters.
Those insights can drive innovation, leading to new features or services that
meet evolving customer needs.
Threats: Individual QoE monitoring accounts for factors outside the provider’s control, such as environmental context (e.g., noisy surroundings [Reichl2015, Jiménez2020]), which may affect user feedback but not reflect actual service performance. Additionally, as mentioned, it may be used as a complaint tool, with users disproportionately reporting negative experiences. There is also the risk of over-engineering solutions by focusing too much on minor individual issues, potentially diverting resources from addressing more significant, system-wide challenges that could have a broader impact on overall service quality
Objective QoE Monitoring
Objective QoE monitoring involves assessing user experience by translating measurable QoS parameters on network level, such as latency, jitter, and packet loss, and on application level, such as video resolution or stalling duration for video streaming, into QoE metrics using predefined models and mapping functions. Unlike individual QoE monitoring, it does not require direct user feedback and instead relies on technically measurable parameters to estimate user satisfaction and various QoE metrics [Hoss2016]. Thereby, the fundamental relationships between system QoE and QoS [Hoss2020] are utilized. For computing the expected system QoE, a MOS mapping function is required, which maps a dedicated QoS value to a MOS value. For computing the system GoB, a GoB mapping function between QoS and GoB is required. Note that the QoS may be a vector of various QoS parameters, which are the input values for the mapping function.
Recent works [Hoss2022] indicated that industrial user experience index values, as obtained by the Threshold-Based Quality (TBQ) model for QoE monitoring, may be accurate enough to derive system QoE metrics. The TBQ model is a framework that defines application-specific thresholds for QoS parameters to assess and classify the user experience, which may be derived with simple and interpretable machine learning models like decision trees.
Strengths: Objective QoE monitoring relies solely on QoS monitoring, making it applicable for network providers, even for encrypted data streams, as long as appropriate QoE models are available, see for example [Juluri2015, Orsolic2020, Casas2022]. It can be easily integrated into existing QoS monitoring tools already deployed, reducing the need for additional resources or infrastructure. Moreover, it offers an objective assessment of user experience, ensuring that the same QoS conditions for different users are consistently mapped to the same QoE scores, as required for QoE fairness.
Weaknesses: Objective QoE monitoring requires specific QoE models and mapping
functions for each desired QoE metric, which can be complex and
resource-intensive to develop. Additionally, it has limited visibility into the
full user experience, as it primarily relies on network-level metrics like
bandwidth, latency, and jitter, which may not capture all factors influencing
user satisfaction. Its effectiveness is also dependent on the accuracy of the
monitored QoS metrics; inaccurate or incomplete data, such as from encrypted
packets, can lead to misguided decisions and misrepresentation of the actual
user experience.
Opportunities: Objective QoE monitoring enables user-centric resource and network management for application and network service providers by tracking QoS metrics, allowing for dynamic adjustments to optimize resource utilization and improve service delivery. The integration of AI and automation with QoS monitoring can increase the efficiency and accuracy of network management from a user-centric perspective. The objective QoE monitoring data can also enhance Service Level Agreements (SLAs) towards Experience Level Agreements (ELAs) as discussed in [Varela2015].
Threats: One risk of Objective QoE monitoring is the potential for incorrect traffic flow characterization, where data flows may be misattributed to the wrong applications, leading to inaccurate QoE assessments. Additionally, rapid technological changes can quickly make existing QoS monitoring tools and QoE models outdated, necessitating constant upgrades and investment to keep pace with new technologies. These challenges can undermine the accuracy and effectiveness of objective QoE monitoring, potentially leading to misinformed decisions and increased operational costs.
Numerical Results: Visualizing the Differences
In this section, we explore and visualize the obtained system QoE metrics, which are based on collected data either through i) individual QoE monitoring or ii) objective QoE monitoring. The question arises if the two monitoring approaches lead to the same results and conclusions for the provider. The obvious approach for computing the system QoE metrics is to use i) the individual ratings collected directly from the users and ii) the MOS scores obtained through mapping the objectively collected QoS parameters. While the discrepancies are derived mathematically in [Hoss2024], this article presents a visual representation of the differences between individual and objective QoE monitoring through a comprehensive simulation study. This simulation approach allows us to quantify the expected system QoE, the system GoB ratio, and the QoE fairness for a multitude of potential system configurations, which we manipulate in the simulation with varying QoS distributions. Furthermore, we demonstrate methods for utilizing data obtained through either individual QoE monitoring or objective QoE monitoring to accurately calculate the system QoE metrics as intended for a provider.
For the numerical results, the web QoE use case in [Hoss2024] is employed. We conduct a comprehensive simulation study, in which the QoS settings are varied. To be more precise, the page load times (PLTs) are varied, such that the users in the system experience a range of different loading times. For each simulation run, the average PLT and the standard deviation of the PLT across all users in the system are fixed. Then each user gets a randomly assigned PLT according to a beta distribution in the range between 0s and 8s with the specified average and standard deviation. The PLTs per user are sampled from that parameterized beta distribution.
For a concrete PLT, the corresponding user rating distribution is available and follows in our case a shifted binomial distribution, where the mean of the binomial distribution reflects the MOS value for that condition. To mention this clearly, this binomial distribution is a conditional random variable with discrete values on a 5-point scale: the user ratings are conditioned on the actual QoS value. For the individual QoE monitoring, the user ratings are sampled from that conditional random variable, while the QoS values are sampled from the beta distribution. For objective QoE monitoring, only the QoS values are used, but in addition, the MOS mapping function provided in [Hoss2024] is used. Thus, each QoS value is mapped to a continuous MOS value within the range of 1 to 5.
Figure 2 shows the expected system QoE using individual QoE monitoring as well as objective QoE monitoring depending on the average QoS as well as the standard deviation of the QoS, which is indicated by the color. Each point in the figure represents a single simulation run with a fixed average QoS and fixed standard deviation. It can be seen that both QoE monitoring approaches lead to the same results, which was also formally proven in [Hoss2024]. Note that higher QoS variances also result in higher expected system since for the same average QoS, there may be some users with larger QoS values, but also some users with lower QoS values. Due to the non-linear mapping between QoS and QoE this results in higher QoE scores.
Figure 3 shows the system GoB ratio, which can be simply computed with individual QoE monitoring. However, in the case of objective QoE monitoring, we assume that only a MOS mapping function is available. It is tempting to derive the GoB ratio by deriving the ratio of MOS values which are good or better. However, this leads to wrong results, see [Hoss2020]. Nevertheless, the GoB mapping function can be approximated from an existing MOS mapping function, see [Hoss2022, Hoss2017, Perez2023]. Then, the same conclusions are then derived through objective QoE monitoring as for individual QoE monitoring.
Figure 4 considers now QoE fairness for both monitoring approaches. It is tempting to use the user rating values from individual QoE monitoring and apply the QoE fairness index. However, in that case, the fairness index considers the variances of the system QoS and additionally the variances due to user rating diversity, as shown in [Hoss2024]. However, this is not the intended application of the QoE fairness index, which aims to evaluate the fairness objectively from a user-centric perspective, such that resource management can be adjusted and to provide users with high and fairly distributed quality. Therefore, the QoE fairness index uses MOS values, such that users with the same QoS are assigned the same MOS value. In a system with deterministic QoS conditions, i.e., the standard deviation diminishes, the QoE fairness index is 100%, see the results for the objective QoE monitoring. Nevertheless, the individual QoE monitoring also allows computing the MOS values for similar QoS values and then to apply the QoE fairness index. Then, comparable results are obtained as for objective QoE monitoring.
Figure 2. Expected system QoE when using individual and objective QoE monitoring. Both approaches lead to the same expected system QoE.
Figure 3. System GoB ratio: Deriving the ratio of MOS values which are good or better does not work for objective QoE monitoring. But an adjusted GoB computation, by approximating GoB through MOS, leads to the same conclusions as individual QoE monitoring, which simply measures the system GoB.
Figure 4. QoE Fairness: Using the user rating values obtained through individual QoE monitoring additionally includes the user rating diversity, which is not desired in network or resource management. However, individual QoE monitoring also allows computing the MOS values for similar QoS values and then to apply the QoE fairness index, which leads to comparable insights as objective QoE monitoring.
Conclusions
Individual QoE monitoring and objective QoE monitoring are fundamentally distinct approaches for assessing system QoE from a provider’s perspective. Individual QoE monitoring relies on direct user feedback to capture personalized experiences, while objective QoE monitoring uses QoS metrics and QoE models to estimate QoE metrics. Both methods have strengths and weaknesses, offering opportunities for service optimization and innovation while facing challenges such as over-engineering and the risk of models becoming outdated due to technological advancements, as summarized in our SWOT analysis. However, as the numerical results have shown, both approaches can be used with appropriate modifications and adjustments to derive various system QoE metrics like expected system QoE, system GoB and PoW ratio, as well as QoE fairness. A promising direction for future research is the development of hybrid approaches that combine both methods, allowing providers to benefit from objective monitoring while integrating the personalization of individual feedback. This could also be interesting to integrate in existing approaches like the QoS/QoE Monitoring Engine proposal [Siokis2023] or for upcoming 6G networks, which may allow the radio access network (RAN) to autonomously adjust QoS metrics in collaboration with the application to enhance the overall QoE [Bertenyi2024].
[Siokis2023] Siokis, A., Ramantas, K., Margetis, G., Stamou, S., McCloskey, R., Tolan, M., & Verikoukis, C. V. (2023). 5GMediaHUB QoS/QoE monitoring engine. In 2023 IEEE 28th International Workshop on Computer Aided Modeling and Design of Communication Links and Networks (CAMAD) (pp. TBD). IEEE.
Abstract: Energy efficiency has become a crucial aspect of today’s IT infrastructures, and video (streaming) accounts for over half of today’s Internet traffic. This column highlights open-source tools, datasets, and solutions addressing energy efficiency in video streaming presented at ACM Multimedia Systems 2024 and its co-located workshop ACM Green Multimedia Systems.
Introduction
Across various platforms, users seek the highest Quality of Experience (QoE) in video communication and streaming. Whether it’s a crucial business meeting or a relaxing evening of entertainment, individuals desire seamless and high-quality video experiences. However, meeting this demand for high-quality video comes with a cost: increased energy usage [1],[2]. This energy consumption occurs at every stage of the process, including content provision via cloud services and consumption on end users’ devices [3]. Unfortunately, this heightened energy consumption inevitably leads to higher CO2 emissions (except for renewable energy sources), posing environmental challenges. It emphasizes the need for studies to assess the carbon footprint of video streaming.
Content provision is a critical stage in video streaming, involving encoding videos into various formats, resolutions, and bitrates. Encoding demands computing power and energy, especially in cloud-based systems. Cloud computing has become famous for video encoding due to its scalability [4] to adjust cloud resources to handle changing workloads and flexibility [5] to scale their operations based on demand. However, this convenience comes at a cost. Data centers, the heart of cloud computing, consume a significant portion of global electricity, around 3% [6]. Video encoding is one of the biggest energy consumers within these data centers. Therefore, optimizing video encoding for lower energy consumption is crucial for reducing the environmental impact of cloud-based video delivery.
Content consumption [7] involves the device using the network interface card to request and download video segments from the server, decompressing them for playback, and finally rendering the decoded frames on the screen, where the energy consumption depends on the screen technology and brightness settings.
The GAIA project showcased its research on the environmental impact of video streaming at the recent 15th ACM Multimedia Systems Conference (April 15-18, Bari, Italy). We presented our findings at relevant conference sessions: Open-Source Software and Dataset and the Green Multimedia Systems (GMSys) workshop.
Open Source Software
GREEM: An Open-Source Benchmark Tool Measuring the Environmental Footprint of Video Streaming [PDF] [Github] [Poster]
GREEM (Gaia Resource Energy and Emission Monitoring) aims to measure energy usage during video encoding and decoding processes. GREEM tracks the effects of video processing on hardware performance and provides a suite of analytical scenarios. This tool offers easy-to-use scenarios covering the most common video streaming situations, such as measuring sequential and parallel video encoding and decoding.
Automates experimentation: It allows users to easily configure and run various encoding scenarios with different parameters to compare results.
In-depth monitoring: The tool traces numerous hardware parameters, specifically monitoring energy consumption and GPU metrics, including core and memory utilization, temperature, and fan speed, providing a complete picture of video processing resource usage.
Visualization: GREEM offers scripts that generate analytic plots, allowing users to visualize and understand their measurement results easily.
Verifiable: GREEM empowers researchers with a tool that has earned the ACM Reproducibility Badge, which allows others to reproduce the experiments and results reported in the paper.
Open Source Datasets
VEED: Video Encoding Energy and CO2 Emissions Dataset for AWS EC2 instances [PDF] [Github] [Poster]
As video encoding increasingly shifts to cloud-based services, concerns about the environmental impact of massive data centers arise. The Video Encoding Energy and CO2 Emissions Dataset (VEED) provides the energy consumption and CO2 emissions associated with video encoding on Amazon’s Elastic Compute Cloud (EC2) instances. Additionally, VEED goes beyond energy consumption as it also captures encoding duration and CPU utilization.
Contributions:
Findability: A comprehensive metadata description file ensures VEED’s discoverability for researchers.
Accessibility: VEED is open for download on GitHub (https://github.com/cd-athena/VEEDdataset), removing access barriers for researchers. Core findings in the research that leverages the VEED dataset have been independently verified (ACM Reproducibility Badge).
Interoperability: The dataset is provided in a comma-separated value (CSV) format, allowing integration with various analysis applications.
Reusability: Description files empower researchers to understand the data structure and context, facilitating its use in diverse analytical projects.
COCONUT: Content Consumption Energy Measurement Dataset for Adaptive Video Streaming [PDF] [Github]
COCONUT is a dataset comprising the energy consumption of video streaming across various devices and different HAS (HTTP Adaptive Streaming) players. COCONUT captures user data during MPEG-DASH video segment streaming on laptops, smartphones, and other client devices, measuring energy consumption at different stages of streaming, including segment retrieval through the network interface card, video decoding, and rendering on the device.This paper has been designated the ACM Artifacts Available badge, signifying that the COCONUT dataset is publicly accessible. COCONUT can be accessed at https://athena.itec.aau.at/coconut/.
Second International ACM Green Multimedia Systems Workshop — GMSys 2024
VEEP: Video Encoding Energy and CO2 Emission Prediction [pdf] [slides]
In VEEP, a machine learning (ML) scheme that empowers users to predict the energy consumption and CO2 emissions associated with cloud-based video encoding.
Contributions:
Content-aware energy prediction: VEEP analyzes video content to extract features impacting encoding complexity. This understanding feeds an ML model that accurately predicts the energy consumption required for encoding the video on AWS EC2 instances. (High Accuracy: Achieves an R² score of 0.96)
Real-time carbon footprint: VEEP goes beyond energy. It also factors in real-time carbon intensity data based on the location of the cloud instance. This allows VEEP to calculate the associated CO2 emissions for your encoding tasks at encoding time.
Resulting impact: By carefully selecting the type and location of cloud instances based on VEEP’s predictions, CO2 emissions can be reduced by up to 375 times. This significant reduction signifies VEEP’s potential to contribute to greener video encoding.
Conclusions
This column provided an overview of the GAIA project’s research on the environmental impact of video streaming, presented at the 15th ACM Multimedia Systems Conference. GREEM measurement tool empowers developers and researchers to measure the energy and CO2 emissions of video processing. VEED provides valuable insights into energy consumption and CO2 emissions during cloud-based video encoding on AWS EC2 instances. COCONUT sheds light on energy usage during video playback on various devices and with different players, aiding in optimizing client-side video streaming. Furthermore, VEEP, a machine learning framework, takes energy efficiency a step further. It allows users to predict energy consumption and CO2 emissions associated with cloud-based video encoding, allowing users to select cloud instances that minimize environmental impact. These studies can help researchers, developers, and service providers to optimize video streaming for a more sustainable future. The focus on encoding and playback highlights the importance of a holistic approach considering the entire video streaming lifecycle. While these papers primarily focus on the environmental impact of video streaming, a strong connection exists between energy efficiency and QoE [8],[9],[10]. Optimizing video processing for lower energy consumption can sometimes lead to trade-offs regarding video quality. Future research directions could explore techniques for optimizing video processing while ensuring a consistently high QoE for viewers.
References
[1] A. Katsenou, J. Mao, and I. Mavromatis, “Energy-Rate-Quality Tradeoffs of State-of-the-Art Video Codecs.” arXiv, Oct. 02, 2022. Accessed: Oct. 06, 2022. [Online]. Available: http://arxiv.org/abs/2210.00618
[2] H. Amirpour, V. V. Menon, S. Afzal, R. Prodan, and C. Timmerer, “Optimizing video streaming for sustainability and quality: The role of preset selection in per-title encoding,” in 2023 IEEE International Conference on Multimedia and Expo (ICME), IEEE, 2023, pp. 1679–1684. Accessed: May 05, 2024. [Online]. Available: https://ieeexplore.ieee.org/abstract/document/10219577/
[4] A. Atadoga, U. J. Umoga, O. A. Lottu, and E. O. Sodiya, “Evaluating the impact of cloud computing on accounting firms: A review of efficiency, scalability, and data security,” Glob. J. Eng. Technol. Adv., vol. 18, no. 2, pp. 065–075, Feb. 2024, doi: 10.30574/gjeta.2024.18.2.0027.
[5] B. Zeng, Y. Zhou, X. Xu, and D. Cai, “Bi-level planning approach for incorporating the demand-side flexibility of cloud data centers under electricity-carbon markets,” Appl. Energy, vol. 357, p. 122406, Mar. 2024, doi: 10.1016/j.apenergy.2023.122406.
[7] C. Yue, S. Sen, B. Wang, Y. Qin, and F. Qian, “Energy considerations for ABR video streaming to smartphones: Measurements, models and insights,” in Proceedings of the 11th ACM Multimedia Systems Conference, 2020, pp. 153–165, doi: 10.1145/3339825.3391867.
[8] G. Bingöl, A. Floris, S. Porcu, C. Timmerer, and L. Atzori, “Are Quality and Sustainability Reconcilable? A Subjective Study on Video QoE, Luminance and Resolution,” in 2023 15th International Conference on Quality of Multimedia Experience (QoMEX), IEEE, 2023, pp. 19–24. Accessed: May 06, 2024. [Online]. Available: https://ieeexplore.ieee.org/abstract/document/10178513/
[9] G. Bingöl, S. Porcu, A. Floris, and L. Atzori, “An Analysis of the Trade-Off Between Sustainability and Quality of Experience for Video Streaming,” in 2023 IEEE International Conference on Communications Workshops (ICC Workshops), IEEE, 2023, pp. 1600–1605. Accessed: May 06, 2024. [Online]. Available: https://ieeexplore.ieee.org/abstract/document/10283614/
[10] C. Herglotz, W. Robitza, A. Raake, T. Hossfeld, and A. Kaup, “Power Reduction Opportunities on End-User Devices in Quality-Steady Video Streaming.” arXiv, May 24, 2023. doi: 10.48550/arXiv.2305.15117.
Immersive experiences have the potential of redefining traditional forms of media engagement by intricately combining reality with imagination. Motivated by necessities, current developments and emerging technologies, this column sets out to bridge immersive experiences in both digital and physical realities. Fitting under the umbrella term of eXtended Reality (XR), the first section describes various realizations of blending digital and physical elements to design what we refer to as immersive digiphysical experiences. We further highlight industry and research initiatives related to driving the design and development of such experiences, considered to be key building-blocks of the futuristic ‘metaverse’. The second section outlines challenges related to assessing, modeling, and managing the Quality of Experience (QoE) of immersive digiphysical experiences and reflects upon ongoing work in the area. While potential use cases span a wide range of application domains, the third section elaborates on the specific case of conference organization, which has over the past few years spanned from fully physical, to fully virtual, and finally to attempts at hybrid organization. We believe this use case provides valuable insights into needs and promising approaches, to be demonstrated and experienced at the upcoming 16th edition of the International Conference on Quality of Multimedia Experience (QoMEX 2024) in Karlshamn, Sweden in June 2024.
Multiple users engaged in a co-located mixed reality experience
Bridging The Digital And Physical Worlds
According to [IMeX WP, 2020], immersive media have been described as involving “multi-modal human-computer interaction where either a user is immersed inside a digital/virtual space or digital/virtual artifacts become a part of the physical world”. Spanning the so-called virtuality continuum [Milgram, 1995], immersive media experiences may involve various realizations of bridging the digital and physical worlds, such as the seamless integration of digital content with the real world (via Augmented or Mixed Reality, AR/MR), and vice versa by incorporating real objects into a virtual environment (Augmented Virtuality, AV). More recently, the term eXtended Reality (XR) (also sometimes referred to as xReality) has been used as an umbrella term for a wide range of levels of “realities”, with [Rauschnabel, 2022] proposing a distinction between AR/MR and Virtual Reality (VR) based on whether the physical environment is, at least visually, part of the user’s experience.
By seamlessly merging digital and physical elements and supporting real-time user engagement with both digital and physical components, immersive digiphysical (i.e., both digitally and physically accessible [Westerlund, 2020]) experiences have the potential of providing compelling experiences blurring the distinction between the real and virtual worlds. A key aspect is that of digital elements responding to user input or the physical environment, and the physical environment responding to interactions with digital objects. Going beyond only visual or auditory stimuli, the incorporation of additional senses, for example via haptic feedback or olfactory elements, can contribute to multisensory engagement [Gibbs, 2022].
The rapid development of XR technologies has been recognized as a key contributor to realizing a wide range of applications built on the fusion of the digital and physical worlds [NEM WP, 2022]. In its contribution to the European XR Coalition (launched by the European Commission), the New European Media Initiative (NEM), Europe’s Technology Platform of Horizon 2020 dedicated to driving the future of digital experiences, calls for needed actions from both industry and research perspectives addressing challenges related to social and human centered XR as well as XR communication aspects [NEM XR, 2022]. One such initiative is the Horizon 2020 TRANSMIXR project [TRANSMIXR], aimed at developing a distributed XR creation environment that supports remote collaboration practices, as well as an XR media experience environment for the delivery and consumption of social immersive media experiences. The NEM initiative further identifies the need for scalable solutions to obtain plausible and convincing virtual copies of physical objects and environments, as well as solutions supporting seamless and convincing interaction between the physical and the virtual world. Among key technologies and infrastructures needed to overcome outlined challenges, the following are identified [NEM XR, 2022]: high bandwidth and low-latency energy-efficient networks; remote computing for processing and rendering deployed on cloud and edge infrastructures; tools for the creation and updating of digital twins (DT) to strengthen the link between the real and virtual worlds, integrating Internet of Things (IoT) platforms; hardware in the form of advanced displays; and various content creation tools relying on interoperable formats.
Merging the digital and physical worlds
Looking towards the future, immersive digiphysical experiences set the stage for visions of the metaverse [Wang, 2023], described as representing the evolution of the Internet towards a platform enabling immersive, persistent, and interconnected virtual environments blending digital and physical [Lee, 2021].[Wang, 2022] see the metaverse as `created by the convergence of physically persistent virtual space and virtually enhance physical reality’. The metaverse is further seen as a platform offering the potential to host real-time multisensory social interactions (e.g., involving sight, hearing, touch) between people communicating with each other in real-time via avatars [Hennig-Thurau, 2023]. As of 2022, the Metaverse Standards Forum is proving a venue for industry coordination fostering the development of interoperability standards for an open and inclusive metaverse [Metaverse, 2023]. Relevant existing standards include: ISO/IEC 23005 (MPEG-V) (standardization of interfaces between the real world and the virtual world, and among virtual worlds) [ISO/IEC 23055], IEEE 2888 (definition of standardized interfaces for synchronization of cyber and physical worlds) [IEEE 2888], and MPEG-I (standards to digitally represent immersive media) [ISO/IEC 23090].
Research Challenges For The Qoe Community
Achieving wide-spread adoption of XR-based services providing
digiphysical experiences across a broad range of application domains (e.g.,
education, industry & manufacturing, healthcare, engineering, etc.)
inherently requires ensuring intuitive, comfortable, and positive user
experiences. While research efforts in meeting such requirements are well under
way, a number of open challenges remain.
Quality of Experience (QoE) for immersive media has been defined as [IMeX WP, 2020] “the degree of delight or annoyance of the user of an application or service which involves an immersive media experience. It results from the fulfillment of his or her expectations with respect to the utility and/or enjoyment of the application or service in the light of the user’s personality and current state.” Furthermore, a bridge between QoE and UX has been established through the concept of Quality of User Experience (QUX), combining hedonic, eudaimonic and pragmatic aspects of QoE and UX [Egger-Lampl, 2019]. In the context of immersive communication and collaboration services, significant efforts are being invested towards understanding and optimizing the end user experience [Perez, 2022].
The White Paper [IMeX WP, 2020] ties immersion to the digital media world (“The more the system blocks out stimuli from the physical world, the more the system is considered to be immersive.”). Nevertheless, immersion as such exists in physical contexts as well, e.g., when reading a captivating book. MR, XR and AV scenarios are digiphysical in their nature. These considerations pose several challenges:
Achieving intuitive and natural interactive experiences[Hennig-Thurau, 2023] when mixing realities.
Developing a common understanding of MR-, XR- and AV-related challenges in digiphysical multi-modal multi-party settings.
Advancing VR, AR, MR, XR and AV technologies to allow for truly digiphysical experiences.
Measuring and modeling QoE, UX and QUX for immersive digiphysical services, covering overall methodology, measurement instruments, modeling approaches, test environments and application domains.
Management of the networked infrastructure to support immersive digiphysical experiences with appropriate QoE, UX and QUX.
Sustainability considerations in terms of environmental footprint, accessibility, equality of opportunities in various parts of the world, and cost/benefit ratio.
Challenges 1 and 2 demand for an experience-based bottom-up approach to focus on the most important aspects. Examples include designing and evaluating different user representations [Aseeri, 2021][Viola, 2023], natural interaction techniques [Spittle, 2023] and use of different environments by participants (AR/MR/VR) [Moslavac, 2023]. The latter has shown beneficial for challenges 3 (cf. the emergence of MR-/XR-/AV-supporting head-mounted devices such as the Microsoft Hololens and recent pass-through versions of the Meta Quest) and 4. Finally, challenges 5 and 6 need to be carefully addressed to allow for long-term adoption and feasibility.
Challenges 1 to 4 have been addressed in standardization. For instance, ITU-T Recommendation P.1320 specifies QoE assessment procedures and metrics for the evaluation of XR telemeetings, outlining various categories of QoE influence factors and use cases [ITU-T Rec. P.1320, 2022] (adopted from the 3GPP technical report TR 26.928 on XR technology in 5G). The corresponding ITU-T Study Group 12 (Question 10) developed a taxonomy of telemeetings [ITU-T Rec. G.1092, 2023], providing a systematic classification of telemeeting systems. Ongoing joint efforts between the VQEG Immersive Media Group and ITU-T Study Group 12 are targeted towards specifying interactive test methods for subjective assessment of XR communications [ITU-T P.IXC, 2022].
The complexity of the aforementioned challenges demand for a combination of fundamental work, use cases, implementations, demonstrations, and testing. One specific use case that has shown its urge during recent years in combining digital and physical realities is that of hybrid conference organization, touching in particular on the challenge of achieving intuitive and natural interactions between remote and physically present participants. We consider this use case in detail in the following section, referring to the organization of the International Conference on Quality of Multimedia Experience (QoMEX) as an example.
Immersive Communication And Collaboration: The Case Of Conference Organization
What seemed to be impossible and was undesirable in the past, became a necessity overnight during the CoVid-19 pandemic: running conferences as fully virtual events. Many research communities succeeded in adapting ongoing conference organizations such that communities could meet, present, demonstrate and socialize online. The conference QoMEX 2020 is one such example, whose organizers introduced a set of innovative instruments to mutually interact and enjoy, such as virtual Mozilla Hubs spaces for poster presentations and a music session with prerecorded contributions mixed to form a joint performance to be enjoyed virtually together. A yet unknown inventiveness was observed to make the best out of the heavily travel-restricted situation. Furthermore, the technical approaches varied from off-the-shelf systems (such as Zoom or Teams) to custom-built applications. However, the majority of meetings during CoVid times, no matter scale and nature, were run in unnatural 2D on-screen settings. The frequently reported phenomenon of videoconference (VC) fatigue can be attributed to a set of personal, organizational, technical and environmental factors [Döring, 2022]. Indeed, talking to one’s computer with many faces staring back, limited possibilities to move freely, technostress [Brod, 1984] and organizational mishaps made many people tired of VC technology that was designed for a better purpose, but could not get close enough to a natural real-life experience.
As CoVid was on its retreat, conferences again became physical events and communities enjoyed meeting again, e.g., at QoMEX 2022. However, voices were raised that asked for remote participation for various reasons, such as time or budget restrictions, environmental sustainability considerations, or simply the comfort of being able to work from home. With remote participation came the challenge of bridging between in-person and remote participants, i.e., turning conferences into hybrid events [Bajpai, 2022]. However, there are many mixed experiences from hybrid conferences, both with onsite and online participants: (1) The onsite participants suffer from interruptions of the session flow needed to fix problems with the online participation tool. Their readiness to devote effort, time, and money to participate in a future hybrid event in person might suffer from such issues, which in turn would weaken the corresponding communities; (2) The online participants suffer from similar issues, where sound irregularities (echo, excessive sound volumes, etc.) are felt to be particularly disturbing, along with feelings of being not properly included e.g., in Q&A-sessions and personal interactions. At both ends, clear signs of technostress and “us-and-them” feelings can be observed. Consequently, and despite good intentions and advice [Bajpai, 2022], any hybrid conference might miss its main purpose to bring researchers together to present, discuss and socialize. To avoid the above-listed issues, the post-CoVid QoMEX conferences (since 2022) avoided hybrid operations, with few exceptions.
A conference is a typical case that reveals difficulties in bringing the physical and digital worlds together [Westerlund, 2020], at least when relying upon state-of-the-art telemeeting approaches that have not explicitly been designed for hybrid and digiphysical operations. At the recent 26th ACM Conference on Computer-Supported Cooperative Work And Social Computing in Minneapolis, USA (CSCW 2023), one of the panel sessions focused on “Realizing Values in Hybrid Environments”. Panelists and audience shared experiences about successes and failures with hybrid events. The main take-aways were as follows: (1) there is a general lack of know-how, no matter how much funds are allocated, and (2) there is a significant demand for research activities in the area.
Yet, there is hope, as increasingly many VR, MR, XR and AV-supporting devices and applications keep emerging, enabling new kinds and representations of immersive experiences. In a conference context, the latter implies the feeling of “being there”, i.e., being integrated in the conference community, no matter where the participant is located. This calls for new ways of interacting amongst others through various realities (VR/MR/XR), which need to be invented, tried and evaluated in order to offer new and meaningful experiences in telemeeting scenarios [Viola, 2023]. Indeed, CSCW 2023 hosted a specific workshop titled “Emerging Telepresence Technologies for Hybrid Meetings: an Interactive Workshop”, during which visions, experiences, and solutions were shared and could be experienced locally and remotely. About half of the participants were online, successfully interacting with participants onsite via various techniques.
With these challenges and opportunities in mind, the motto of QoMEX 2024 has been set as “Towards immersive digiphysical experiences.” While the conference is organized as an in-person event, a set of carefully selected hybrid activities will be offered to interested remote participants, such as (1) 360° stereoscopic streaming of the keynote speeches and demo sessions, and (2) the option to take part in so-called hybrid experience demos. The 360° stereoscopic streaming has so far been tested successfully in local, national and transatlantic sessions (during the above-mentioned CSCW workshop) with various settings, and further fine-tuning will be done and tested before the conference. With respect to the demo session – and in addition to traditional onsite demos – this year, the conference will in particular solicit hybrid experience demos that enable both onsite and remote participants to test the demo in an immersive environment. Facilities will also be provided for onsite participants to test demos from both the perspective of a local and remote user, enabling them to experience different roles. The organizers of QoMEX 2024 hope that the hybrid activities of QoMEX 2024 will trigger more research interest in these areas along and beyond the classical lines of QoE research (to perform quantitative subjective studies of QoE features and correlating them with QoE factors).
As immersive
experiences extend into both digital and physical worlds and realities, there
is a great space to conquer for QoE, UX, and QUX-related research. While the
recent CoVid pandemic has forced many users to replace physical with digital
meetings and sustainability considerations have reduced many peoples’ and
organizations’ readiness to (support) travel, shortcomings of hybrid
digiphysical meetings have failed to persuade their participants of their
superiority over pure online or on-site meetings. Indeed, one promising path
towards a successful integration of physical and digital worlds consists of
trying out, experiencing, reflecting, and deriving important research questions
for and beyond the QoE research community The upcoming conference QoMEX 2024
will be a stop along this road with carefully selected hybrid experiences aimed
at boosting research and best practice in the QoE domain towards immersive
digiphysical experiences.
References
[Aseeri, 2021] Aseeri, S., & Interrante, V. (2021). The Influence of Avatar Representation on Interpersonal Communication in Virtual Social Environments. IEEE Transactions on Visualization and Computer Graphics, 27(5), 2608-2617.
[Bajpai, 2022] Bajpai, V., et al.. (2022). Recommendations for designing hybrid conferences. ACM SIGCOMM Computer Communication Review, 52(2), 63-69.
[Brod, 1984] Brod, C. (1984). Technostress: The Human Cost of the Computer Revolution. Basic Books; New York, NY, USA: 1984.
[Döring, 2022] Döring, N., Moor, K. D., Fiedler, M., Schoenenberg, K., & Raake, A. (2022). Videoconference Fatigue: A Conceptual Analysis. International Journal of Environmental Research and Public Health, 19(4), 2061.
[Egger-Lampl, 2019] Egger-Lampl, S., Hammer, F., & Möller, S. (2019). Towards an integrated view on QoE and UX: adding the Eudaimonic Dimension, ACM SIGMultimedia Records, 10(4):5.
[Gibbs, 2022] Gibbs, J. K., Gillies, M., & Pan, X. (2022). A comparison of the effects of haptic and visual feedback on presence in virtual reality. International Journal of Human-Computer Studies, 157, 102717.
[Hennig-Thurau, 2023] Hennig-Thurau, T., Aliman, D. N., Herting, A. M., Cziehso, G. P., Linder, M., & Kübler, R. V. (2023). Social Interactions in the Metaverse: Framework, Initial Evidence, and Research Roadmap. Journal of the Academy of Marketing Science, 51(4), 889-913.
[IMeX WP, 2020] Perkis, A., Timmerer, C., et al., “QUALINET White Paper on Definitions of Immersive Media Experience (IMEx)”, European Network on Quality of Experience in Multimedia Systems and Services, 14th QUALINET meeting (online), May 25, 2020. Online: https://arxiv.org/abs/2007.07032
[ISO/IEC 23055] ISO/IEC 23005 (MPEG-V) standards, Media Context and Control, https://mpeg.chiariglione.org/standards/mpeg-v, accessed January 21, 2024.
[ISO/IEC 23090] ISO/IEC 23090 (MPEG-I) standards, Coded representation of Immersive Media, https://mpeg.chiariglione.org/standards/mpeg-i, accessed January 21, 2024.
[IEEE 2888] IEEE 2888 standards, https://sagroups.ieee.org/2888/, accessed January 21, 2024.
[ITU-T Rec.. G.1092, 2023] ITU-T Recommendation G.1092 – Taxonomy of telemeetings from a quality of experience perspective, Oct. 2023.
[ITU-T P.IXC, 2022] ITU-T Work Item: Interactive test methods for subjective assessment of extended reality communications, under study,” 2022.
[Lee, 2021] Lee, L. H. et al. (2021). All One Needs to Know about Metaverse: A Complete Survey on Technological Singularity, Virtual Ecosystem, and Research Agenda. arXiv preprint arXiv:2110.05352.
[Milgram, 1995] Milgram, P., Takemura, H., Utsumi, A., & Kishino, F. (1995, December). Augmented reality: A class of displays on the reality-virtuality continuum. In Telemanipulator and telepresence technologies (Vol. 2351, pp. 282-292). International Society for Optics and Photonics.
[Moslavac, 2023] Moslavac, M., Brzica, L., Drozd, L., Kušurin, N., Vlahović, S., & Skorin-Kapov, L. (2023, July). Assessment of Varied User Representations and XR Environments in Consumer-Grade XR Telemeetings. In 2023 17th International Conference on Telecommunications (ConTEL) (pp. 1-8). IEEE.
[Rauschnabel, 2022] Rauschnabel, P. A., Felix, R., Hinsch, C., Shahab, H., & Alt, F. (2022). What is XR? Towards a Framework for Augmented and Virtual Reality. Computers in human behavior, 133, 107289.
[NEM WP, 2022] New European Media (NEM), NEM: List of topics for the Work Program 2023-2024.
[NEM XR, 2022] New European Media (NEM), NEM contribution to the XR coalition, June 2022.
[Perez, 2022] Pérez, P., Gonzalez-Sosa, E., Gutiérrez, J., & García, N. (2022). Emerging Immersive Communication Systems: Overview, Taxonomy, and Good Practices for QoE Assessment. Frontiers in Signal Processing, 2, 917684.
[Spittle, 2023] Spittle, B., Frutos-Pascual, M., Creed, C., & Williams, I. (2023). A Review of Interaction Techniques for Immersive Environments. IEEE Transactions on Visualization and Computer Graphics, 29(9), Sept. 2023.
[TRANSMIXR] EU HORIZON 2020 TRANSMIXR project, Ignite the Immersive Media Sector by Enabling New Narrative Visions, https://transmixr.eu/
[Viola, 2023] Viola, I., Jansen, J., Subramanyam, S., Reimat, I., & Cesar, P. (2023). VR2Gather: A Collaborative Social VR System for Adaptive Multi-Party Real-Time Communication. IEEE MultiMedia, 30(2).
[Wang 2023] Wang, H. et al. (2023). A Survey on the Metaverse: The State-of-the-Art, Technologies, Applications, and Challenges. IEEE Internet of Things Journal, 10(16).
[Wang, 2022] Wang, Y. et al. (2022). A Survey on Metaverse: Fundamentals, Security, and Privacy. IEEE Communications Surveys & Tutorials, 25(1).
[Westerlund, 2020] Westerlund, T. & Marklund, B. (2020). Community pharmacy and primary health care in Sweden – at a crossroads. Pharm Pract (Granada), 18(2): 1927.
Data-driven Quality of Experience (QoE) modelling using Machine Learning (ML) arose as a promising alternative to the cumbersome and potentially biased manual QoE modelling. However, the reasoning of a majority of ML models is not explainable due to their black-box characteristics, which prevents us from gaining insights about how the model actually related QoE influence factors and QoE. These fundamental relationships are highly relevant for QoE researchers and service and network providers though.
With the emerging field of eXplainable Artificial Intelligence (XAI) and its recent technological advances, these issues can now be resolved. As a consequence, XAI enables data-driven QoE modelling to obtain generalizable QoE models and provides us simultaneously with the model’s reasoning on which QoE factors are relevant and how they affect the QoE score. In this work, we showcase the feasibility of explainable data-driven QoE modelling for video streaming and web browsing, before we discuss the opportunities and challenges of deploying XAI for QoE modelling.
Introduction
In order to enhance services and networks and prevent users from switching to competitors, researchers and service providers need a deep understanding of the factors that influence the Quality of Experience (QoE) [1]. However, developing an effective QoE model is a complex and costly endeavour. Typically, it requires dedicated and extensive studies, which can only cover a limited portion of the parameter space and may be influenced by the study design. These studies often generate a relatively small sample of QoE ratings from a comparatively small population, making them vulnerable to poor performance when applied to unseen data. Moreover, the process of collecting and processing data for QoE modelling is not only arduous and time-consuming, but it can also introduce biases and self-fulfilling prophecies, such as perceiving an exponential relationship when one is expected.
To overcome these challenges, data-driven QoE modelling utilizing machine learning (ML) has emerged as a promising alternative, especially in scenarios where there is a wealth of data available or where data streams can be continuously obtained. A notable example is the ITU-T standard P.1203 [2], which estimates video streaming QoE by combining manual modelling – accounting for 75% of the Mean Opinion Score (MOS) estimation – and ML-based Random Forest modelling – accounting for the remaining 25%. The inclusion of the ML component in P.1203 indicates its ability to enhance performance. However, the inner workings of P.1203’s Random Forest model, specifically how it calculates the output score, are not obvious. Also, the survey in [3] shows that ML-based QoE modelling in multimedia systems is already widely used, including Virtual Reality, 360-degree video, and gaming. However, the QoE models are based on shallow learning methods, e.g., Support Vector Machines (SVM), or on deep learning methods, which lack explainability. Thus, it is difficult to understand what QoE factors are relevant and how they affect the QoE score [13], resulting in a lack of trust in data-driven QoE models and impeding their widespread adoption by researchers and providers [14].
Fortunately, recent advancements in the field of eXplainable Artificial Intelligence (XAI) [6] have paved the way for interpretable ML-based QoE models, thereby fostering trust between stakeholders and the QoE model. These advancements encompass a diverse range of XAI techniques that can be applied to existing black-box models, as well as novel and sophisticated ML models designed with interpretability in mind. Considering the use case of modelling video streaming QoE from real subjective ratings, the work in [4] evaluates the feasibility of explainable, data-driven QoE modelling and discusses the deployment of XAI for QoE research.
The utilization of XAI for QoE modelling brings several benefits. Not only does it speed up the modelling process, but it also enables the identification of the most influential QoE factors and their fundamental relationships with the Mean Opinion Score (MOS). Furthermore, it helps eliminate biases and preferences from different research teams and datasets that could inadvertently influence the model. All that is required is a selective dataset with descriptive features and corresponding QoE ratings (labels), which covers the most important QoE influence factors and, in particular, also rare events, e.g., many stalling events in a session. Generating such complete datasets, however, is an open research question, but calls for data-centric AI [15]. By merging datasets from various studies, more robust and generalizable QoE models can theoretically be created. These studies need to have a common ground though. Another benefit is the fact that the models can also be automatically refined over time as new QoE studies are conducted and additional data becomes available.
XAI: eXplainable Artificial Intelligence
For a comprehensive understanding of eXplainable Artificial Intelligence (XAI), a general overview can be found in [5], while a thorough survey on XAI methods and a taxonomy of XAI methods, in general, is available in [6].
XAI methods can be categorized into two
main types: local and global explainability techniques. Local explainability
aims to provide explanations for individual stimuli in terms of QoE factors and
QoE ratings. On the other hand, global explainability focuses on offering
general reasoning for how a model derives the QoE rating from the underlying
QoE factors. Furthermore, XAI methods can be classified into post-hoc
explainers and interpretable models.
Post-hoc explainers [6] are commonly used to explain various black-box models, such as neural networks or ensemble techniques after they have been trained. One widely utilized post-hoc explainer is SHAP values [7], which originates from game theory. SHAP values quantify the contribution of each feature to the model’s prediction by considering all possible feature subsets and learning a model for each subset. Other post-hoc explainers include LIME and Anchors, although they are limited to classification tasks.
Interpretable models, by design, provide
explanations for how the model arrives at its output. Well-known interpretable
models include linear models and decision trees. Additionally, generalized
additive models (GAM) are gaining recognition as interpretable models.
A GAM is a generalized linear model in which the model output is computed by summing up each of the arbitrarily transformed input features along with a bias [8]. The form of a GAM enables a direct interpretation of the model by analyzing the learned functions and the transformed inputs, which allows to estimate the influence of a feature. Two state-of-the-art ML-based GAM models are Explainable Boosting Machine (EBM) [9] and Neural Additive Model (NAM) [8]. While EBM uses decision trees to learn the functions and gradient boosting to improve training, NAM utilizes arbitrary neural networks to learn the functions, resulting in a neural network architecture with one sub-network per feature. EBM extends GAM by also considering additional pairwise feature interaction terms while maintaining explainability.
Exemplary XAI-based QoE Modelling using GAMs
We demonstrate the learned predictor functions for both EBM (red) and NAM (blue) on a video QoE dataset in Figure 1. All technical details about the dataset and the methodology can be found in [4]. We observe that both models provide smooth shape functions, which are easy to interpret. EBM and NAM differ only marginally and mostly in areas where the data density is low. Here, EBM outperforms NAM by overfitting on single data points using the feature interaction terms. We can see this, for example, for a high total stalling duration and a high number of quality switches, where at some point EBM stops the negative trend and strongly contrasts its previous trend to improve predictions for extreme outliers.
Using the smooth predictor functions, it is easy to apply curve fitting. In the bottom right plot of Figure 1, we fit the average bitrate predictor function of NAM, which was shifted by the average MOS of the dataset to obtain the original MOS scale on the y-axis, on an inverted x-axis using exponential (IQX), logarithmic (WQL), and linear functions (LIN). Note that this constitutes a univariate mapping of average bitrate to MOS, neglecting the other influencing factors. We observe that our predictor function follows the WQL hypothesis [10] (red) with a high R²=0.967. This is in line with the mechanics of P.1203, where the authors of [11] showed the same logarithmic behavior for the bitrate in mode 0.
As the presented XAI methods are universally applicable to any QoE dataset, Figure 2 shows a similar GAM-based QoE modelling for a web QoE dataset obtained from [12]. We can see that the loading behavior in terms of ByteIndex-Page Load Time (BI-PLT) and time to last byte (TTLB) has the strongest impact on web QoE. Moreover, we see that different URLs/webpages have a different effect on the MOS, which shows that web QoE is content dependent. Summarizing, using GAMs, we obtain valuable easy to interpret functions, which explain fundamental relationships between QoE factors and MOS. Nevertheless, further XAI methods can be utilized, as detailed in [4,5,6].
Discussion
In addition to expediting the modelling process and mitigating modelling biases, data-driven QoE modelling offers significant advantages in terms of improved accuracy and generalizability compared to manual QoE models. ML-based models are not constrained to specific classes of continuous functions typically used in manual modelling, allowing them to capture more complex relationships present in the data. However, a challenge with ML-based models is the risk of overfitting, where the model becomes overly sensitive to noise and fails to capture the underlying relationships. Overfitting can be avoided through techniques like model regularization or by collecting sufficiently large or complete datasets.
Successful implementation of data-driven QoE modelling relies on purposeful data collection. It is crucial to ensure that all (or at least the most important) QoE factors are included in the dataset, covering their full parameter range with an adequate number of samples. Controlled lab or crowdsourcing studies can define feature values easily, but budget constraints (time and cost) often limit data collection to a small set of selected feature values. Conversely, field studies can encompass a broader range of feature values observed in real-world scenarios, but they may only gather limited data samples for rare events, such as video sessions with numerous stalling events. To prevent data bias, it is essential to balance feature values, which may require purposefully generating rare events in the field. Additionally, thorough data cleaning is necessary. While it is possible to impute missing features resulting from measurement errors, doing so increases the risk of introducing bias. Hence, it is preferable to filter out missing or unusual feature values.
Moreover, adding new data and retraining an ML model is a natural and straightforward process in data-driven modelling, offering long-term advantages. Eventually, data-driven QoE models would be capable of handling concept drift, which refers to changes in the importance of influencing factors over time, such as altered user expectations. However, QoE studies are rarely conducted as temporal and population-based snapshots, limiting frequent model updates. Ideally, a pipeline could be established to provide a continuous stream of features and QoE ratings, enabling online learning and ensuring the QoE models remain up to date. Although challenging for research endeavors, service providers could incorporate such QoE feedback streams into their applications
Comparing black-box and interpretable ML models, there is a slight trade-off between performance and explainability. However, as shown in [4], it should be negligible in the context of QoE modelling. Instead, XAI allows to fully understand the model decisions, identifying relevant QoE factors and their relationships to the QoE score. Nevertheless, it has to be considered that explaining models becomes inherently more difficult when the number of input features increases. Highly correlated features and interactions may further lead to misinterpretations when using XAI since the influence of a feature may also depend on other features. To obtain reliable and trustworthy explainable models, it is, therefore, crucial to exclude highly correlated features.
Finally, although we demonstrated XAI-based QoE modelling only for video streaming and web browsing, from a research perspective, it is important to understand that the whole process is easily applicable in other domains like speech or gaming. Apart from that, it can also be highly beneficial for providers of services and networks to use XAI when implementing a continuous QoE monitoring. They could integrate visualizations of trends like Figure 1 or Figure 2 into dashboards, thus, allowing to easily obtain a deeper understanding of the QoE in their system.
Conclusion
In conclusion, the progress in technology has made data-driven explainable QoE modeling suitable for implementation. As a result, it is crucial for researchers and service providers to consider adopting XAI-based QoE modeling to gain a comprehensive and broader understanding of the factors influencing QoE and their connection to users’ subjective experiences. By doing so, they can enhance services and networks in terms of QoE, effectively preventing user churn and minimizing revenue losses.
References
[1] K. Brunnström, S. A. Beker, K. De Moor, A.
Dooms, S. Egger, M.-N. Garcia, T. Hossfeld, S. Jumisko-Pyykkö, C. Keimel, M.-C.
Larabi et al., “Qualinet White Paper on Definitions of Quality of Experience,”
2013.
[2] W. Robitza, S. Göring, A. Raake, D.
Lindegren, G. Heikkilä, J. Gustafsson, P. List, B. Feiten, U. Wüstenhagen, M.-N.
Garcia et al., “HTTP Adaptive Streaming QoE Estimation with ITU-T Rec. P. 1203:
Open Databases and Software,” in ACM MMSys, 2018
[3] G. Kougioumtzidis, V. Poulkov, Z. D.
Zaharis, and P. I. Lazaridis, “A Survey on Multimedia Services QoE Assessment
and Machine Learning-Based Prediction,” IEEE Access, 2022.
[4] N. Wehner, A. Seufert, T. Hoßfeld, M. and
Seufert, “Explainable Data-Driven QoE Modelling with XAI,” QoMEX, 2023.
[6] A. B. Arrieta, N. Diıaz-Rodriguez et al.,
“Explainable Artificial Intelligence (XAI): Concepts, Taxonomies, Opportunities
and Challenges Toward Responsible AI,” Information fusion, 2020.
[7] S. M. Lundberg and S.-I. Lee, “A Unified
Approach to Interpreting Model Predictions,” NIPS, 2017.
[8] R. Agarwal, L. Melnick, N. Frosst, X.
Zhang, B. Lengerich, R. Caruana, and G. E. Hinton, “Neural Additive Models:
Interpretable MachineLearning with Neural Nets,” NIPS, 2021.
[9] H. Nori, S. Jenkins, P. Koch, and R.
Caruana, “InterpretML: A Unified Framework for Machine Learning
Interpretability,” arXiv preprint arXiv:1909.09223, 2019.
[10] T. Hoßfeld, R. Schatz, E. Biersack, and
L. Plissonneau, “Internet Video Delivery in YouTube: From Traffic Measurements
to Quality of Experience,” in Data Traffic Monitoring and Analysis, 2013.
[11] M. Seufert, N. Wehner, and P. Casas,
“Studying the Impact of HAS QoE Factors on the Standardized Qoe Model P. 1203,”
in ICDCS, 2018
[12] D. N. da Hora, A. S. Asrese, V.
Christophides, R. Teixeira, D. Rossi, “Narrowing the gap between QoS metrics
and Web QoE using Above-the-fold metrics,” PAM, 2018
[13] A. Seufert, F. Wamser, D. Yarish, H.
Macdonald, and T. Hoßfeld, “QoE Models in the Wild: Comparing Video QoE Models
Using a Crowdsourced Data Set”, in QoMEX, 2021
[14] D. Shin, “The effects of explainability
and causability on perception, trust, and acceptance: Implications for
explainable AI”, in International Journal of Human-Computer Studies, 2021.
[15] D. Zha, Z. P. Bhat, K. H. Lai, F. Yang,
& X. Hu, “Data-centric ai: Perspectives and challenges”, in SIAM
International Conference on Data Mining, 2023