Encouraging Scientific Collaborations with ConfFlow 2021

Introduction

We often find other collaborators by chance at a conference or by looking for them specifically through their papers. However, sometimes hidden potential social connections might exist between different researchers that cannot be immediately observed because the keywords we use might not always represent the entire space of similar research interests. As a community, Multimedia (MM) is so diverse that it is easy for community members to miss out on very useful expertise and potentially fruitful collaborations. There is a lot of latent knowledge and potential synergies that could exist if we were to offer conference attendees an alternative perspective on their similarities to other attendees. ConfFlow is an online application that offers an alternative perspective on finding new research connections. It is designed to help researchers find others at conferences with complementary research interests for collaboration. With ConfFlow we take a data-driven approach by using something similar to the Toronto Paper Matching System (TPMS), used to identify suitable reviewers for papers, to construct a similarity embedding space for researchers to find other researchers. 

In this report, we discuss the follow up to the 2020 ConfFlow edition which was run at MMSys, MM, ICMR in 2021. We created separate editions of ConfFlow for each conference, processing 2642 (MM), 272 (MMSys), and 494 (ICMR) accepted authors from each conference.

Both the 2020 and 2021 editions of ConfFlow were funded by the SIGMM special initiatives fund.

New Functionality

In the 2020 edition of ConfFlow, we created an interface allowing authors at the MM 2020 conference to browse the research similarity space with others. Each user needs to claim their Google scholar account in the application before using it. We implemented a strict privacy-sensitive policy allowing data of individuals only to be shown if they consented to use the database; even public data was not shown as the processed public data might be considered a privacy invasion. Unfortunately, because of this strict policy, and very little uptake of the application, the full experience of the application was not possible for any user. In the 2021 edition, we updated the privacy policy to be more permissive, whilst still secure (see discussion in the Privacy and Ethical Considerations section below).

From our experiences from the 2020 edition, we identified some bottlenecks that could be improved upon. To that end, we made the following augmentations:

  • Improved frontend design: We did an overhaul of the interface to make it more modern, visually appealing, and user-friendly. The design was also slightly changed to accommodate new functionalities
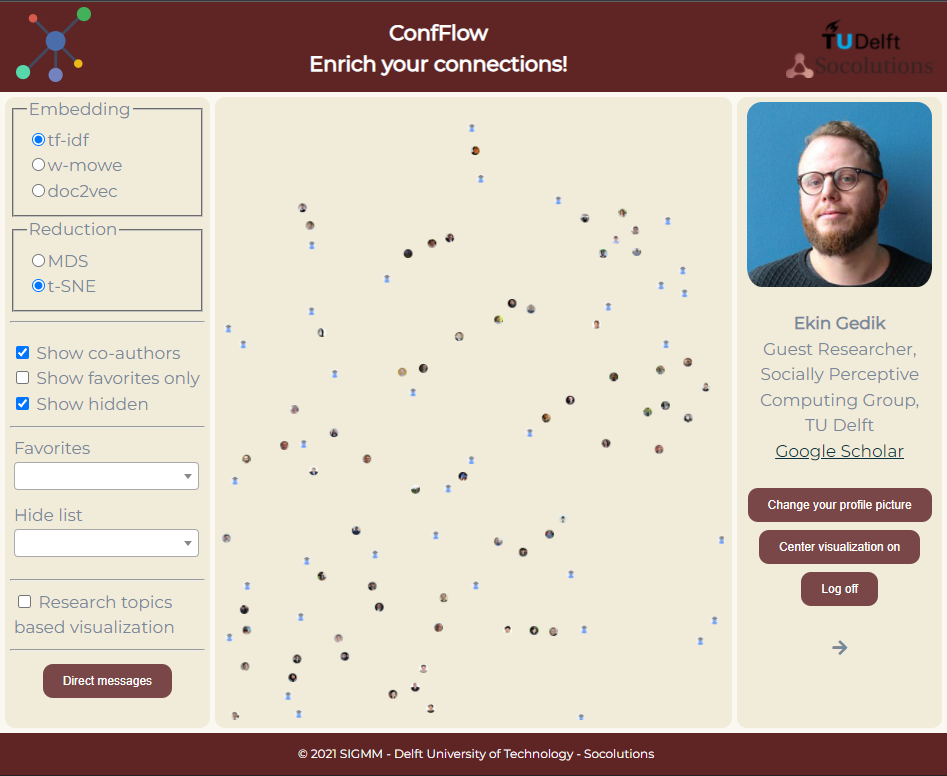
  • New embedding options: We added two more options to choose how the similarity space is formed; word2vec (tf-idf weighted mean word2vec embeddings: w(eighted)-m(ean)o(f)w(ord)e(mbeddings)) and doc2vec (see Figure 1)
Figure 1. Screenshot showing the new embedding functionality (m-mowe and doc2vec)
  • Interactive tutorial for onboarding: We included an interactive tutorial that showcases the full range of functionalities to the users when they first log in (see Figure 2)
  • Direct messaging functionality: We added direct messaging to ConfFlow, allowing direct communication between attendees (see Figure 3)
  • Scaling ConfFlow and making it cheaper to run in the future: There is an economy of scale to only needing to update the ConfFlow database with conference newcomers. We made the following steps to make the process more efficient:
    • Generating a database of verified authors from the lists of SIGMM conference attendees listed on the ACM website in the last 6 years.
    • A helper tool for finding google scholar profiles of newcomers quicker as they needed to be manually verified for security reasons.

Deployment

Method

ConfFlow was rolled out to 3 conferences starting with MMSys 2021 (Istanbul, Turkey)  in September, Multimedia 2021 (Chengdu, China)  in October, and ICMR (Taipei, Taiwan) 2021 in November rather than just ACM MM in 2020. All MMSys and MM conferences were organized as hybrid events whilst ICMR was finally organized virtually after having to be rescheduled twice.

We asked all general and program chairs of each respective conference to provide the author lists of the accepted papers in the conference at least 1 month before the conference started. This was in the end a compromise between obtaining just the actual conference attendees (which would have made social connection easier if the conferences had been in-person only) and being able to get conference relevant participants sufficiently ahead of time in order to disambiguate identities and start the time-consuming computations of the embedding spaces. Given the added complication that MMSys and Multimedia were hybrid, the problem of waiting for the final conference registration list was that we would need to wait until very close to the conference itself to get the latest attendee list. In any case, even if we knew, the hybrid nature of the conference made virtual social connection still the more viable option. Use of the attendee list would also make it harder to pre-announce the application just before the conference started. Given also that the conference organizers were very occupied with handling the many uncertainties of conference organization during the pandemic, we decided that obtaining the author lists was the least risky approach.

Aside from getting the author lists, we also asked the conference organizers for support in disseminating the application to the conference attendees. A separate edition of ConfFlow needed to be generated for each conference. The following strategies were used for disseminating the application via the conference directly and from a personal account:

  • MMSys: slack channel, Twitter (conference, personal, and sigmm), weixin, weibo, facebook, presentation slides during conference general announcements
  • ACM MM: Twitter (conference and sigmm), whova, presentation slide during the conference banquet
  • ICMR:  Twitter (conference, personal, and sigmm).

We tried a different strategy compared to last year to catch people’s attention to the application by a more comprehensive dissemination strategy and also short catchy explanatory videos to communicate the functionalities of the application. These were embedded in our social media dissemination campaigns.

Following on from that, we issued an online survey to gauge how people in the community at large felt about social interaction and, if they had used ConfFlow, how was their experience of the app. This was sent shortly after the conference by email to all those that used the application and then also 1 week later as a reminder. Posts were also sent out on Twitter and Facebook to encourage people in the community to fill in the survey even if they had not used ConfFlow. The survey was divided into questions related to collaboration in general, their experience using ConfFlow, and questions about how the application experience could be changed. Further details about the questions are shown in the Appendix. 

Privacy and Ethical Considerations

The first edition of ConfFlow (2020) had a very restrictive opt-in only policy. This made the visualization hard to use for interested users, thus severely hindering the user experience. Users unanimously asked for visualization of the other researchers in the community. Therefore, any already publicly available information from a user’s google scholar account or ACM website and derived visualizations were displayed to everyone. Information that is not available publicly online such as their individual usage behavior, their visualization options, whether their ConfFlow account is activated or not etc is not shown publicly. 

Application Realization

For security reasons, each user cannot use ConfLab until they have claimed their account. This is needed because each account has preferences related to the ConfFlow interface – settings such as hiding particular researchers, having researchers marked as ‘favourites’ as well as the direct messaging functionality. We used very strict security procedures for the building of ConfFlow and this also meant that to retrieve a user’s preferences in the application, a user’s identity needed to be verified when a user claims their account. We do this by associating the author’s name and affiliation with a Google scholar profile and then a user needs to verify their identity with respect to their Google scholar account. In some cases, it is necessary to manually assign an author to a Google scholar profile because there are too many profiles with the same name; sometimes many author names can be associated with the same Google scholar account. To this end, one of the main new functionalities was the creation of a database of all SIGMM community members who had published at the MM conference recently. That way, their name and google scholar profile only needs to be associated once and can easily be re-used in future editions of ConfLab. This manual effort aspect of the process varied across the three different conferences in which ConfLab was created. We elaborate on this below. An additional helper function was created to allow faster manual verification in cases of ambiguity.

ConfFlow at ACM SIGMM

We describe some statistics for each edition of ConfFlow at the three conferences of SIGMM in 2021: MMSys, MM, and ICMR. We list them in chronological order of when the conference occurred in the calendar year.

ACM MMSys

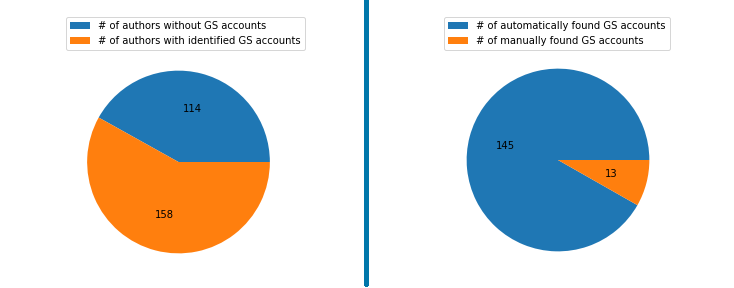
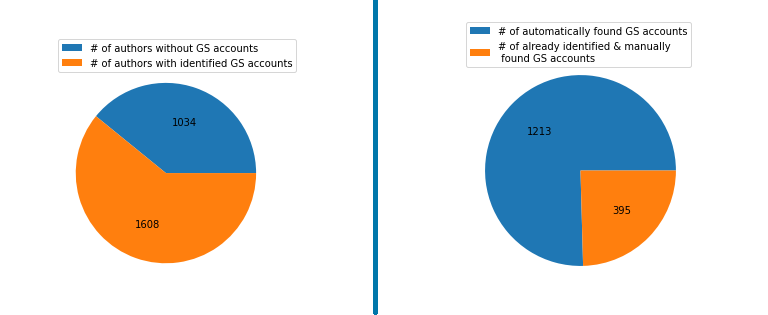
The author list provided by General Chairs of MMSys had 272 unique authors. As shown in Figure 4.,  we were able to identify Google Scholar accounts of 158 authors. 145 of these accounts were identified automatically using the provided author information: name, affiliation, and e-mail domain. 13 accounts identified by the automatic process were tagged as ambiguous and required manual validation.

Figure 4. Author statistics for ACM MMSys‘21

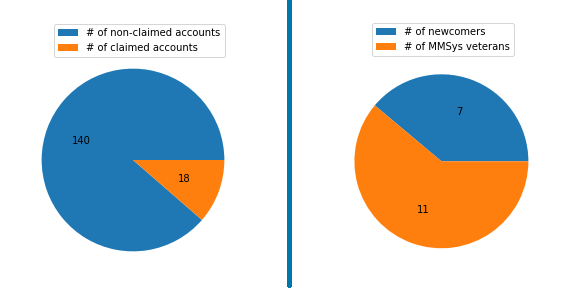
We created ConfFlow accounts for 145 identified authors. As shown in Figure 5, 18 users claimed their accounts and used ConfFlow during the conference. Further analysis showed that 7 out of 18 users were newcomers to MMSys i.e., it was their first publication at this conference. 

After sending out the survey request to the 18 users after the conference, we obtained 1 survey response from a PhD student. Due to the low response rate, we do not report the responses.

Figure 5. User statistics for ConfFlow-MMSys‘21

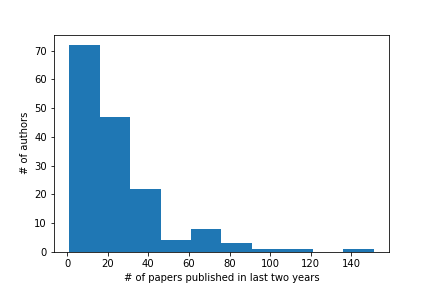
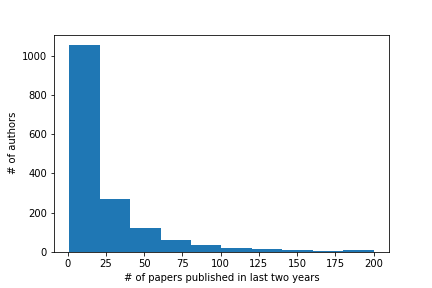
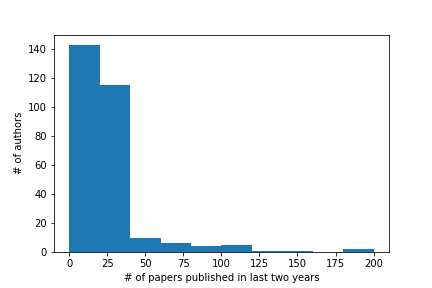
The similarity space visualized in ConfFlow is based on the publications of authors in the last two years. Figure 6 shows the distribution of the number of papers MMSys authors published in the last two years. We show this because for each identified author, we take all the papers they published in the last 2 years to generate the latent representation of their research interests. What was particularly interesting to see is how many researchers were publishing 30 or more papers in the last 2 years. They account for a significant proportion of the authors of the conference who may be too busy to find new research connections. However, there is also a significant proportion of researchers publishing less than 30 papers a year who could find Conf Lab useful.

Figure 6. Histogram of the number of publications in the last 2 years for MMSys’21 authors.

ACM Multimedia

We realized that users without a Google scholar profile could not use ConfLab at all so for the Multimedia edition, we added a view-only (guest account) option of ConfLab and advertised it on social media accordingly. This view-only account also allowed researchers who did not want to claim their account to browse the embedding space. The disadvantage of this approach is that the application does not immediately centre on the user in the embedding space. Given the large number of authors at Multimedia, this made it extremely hard for view-only users to find themselves, which may have made it harder for them to appreciate the utility of the application. 

As shown in  Figure 7,  the author list provided by General Chairs of Multimedia had 2642 unique authors. We were able to identify Google Scholar accounts of 1608 authors. 1213 of these accounts were identified automatically using the provided author information: name, affiliation, and e-mail domain. 225 authors were already identified in the previous iterations of ConfFlow for ACM MMSys ‘21 and MM ‘20. We then manually analyzed the remaining 1204 authors that were either tagged as ambiguous matches by the automatic process or returned no matches at all. We were able to identify an additional 170 accounts with the manual search. This highlights how challenging it is to establish an online identity for all authors in order for them to use ConfFlow, despite manual intervention.

Figure 7. Author statistics for MM’21

We created ConfFlow accounts for the identified authors. As shown in Figure 8, 16 users claimed their accounts and used ConfFlow during the conference. Further analysis showed that 9 out of 16 users were newcomers to MMSys i.e., it was their first publication at this conference. 5 attendees requested access to the guest account.

Figure 8. User statistics for ConfFlow-MM’21.

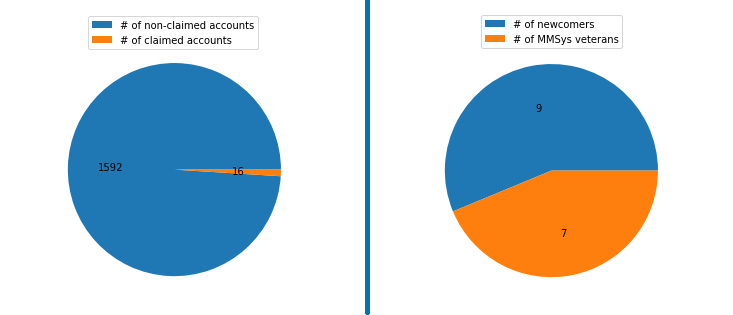
Figure 9 shows the distribution of the number of papers.  Multimedia 2021 authors published in the last two years. It is interesting to see a more skewed distribution towards people with fewer publications compared to the MMSys edition. This would suggest that there are potentially more researchers who would find ConfFlow interesting as a social connection tool. However, both MMSys and Multimedia had very similar numbers of users despite Multimedia being almost 10 times bigger. This may be related to the fact that we were able to be in closer communication with the general chairs of MMSys who gave us access to more channels of communication (including a slide announcement during the conference opening). Meanwhile, at MM, the initial dissemination via Whova (which was the first line of attack) did not yield any new users at all and the Multimedia social media feed (Twitter)  had very few followers – this could be explained by the fact that Twitter is not used by many of our colleagues in Asia and Multimedia was being run in Chengdu. We do not have statistics on the proportion of hybrid vs. in-person attendees which may also have affected usage. 

Figure 9. Histogram of the number of publications in the last 2 years for all identified authors of MM’21.

ICMR

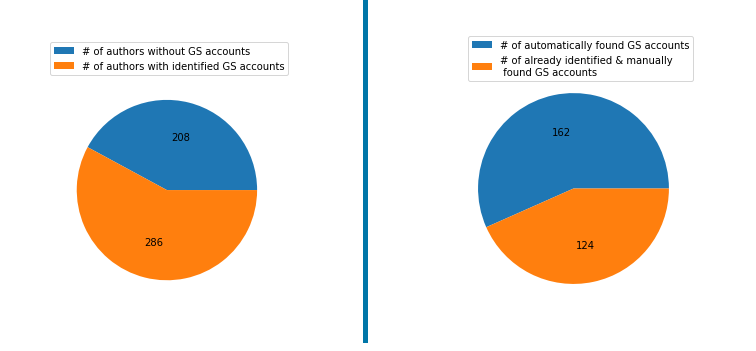
The author list provided by the General Chairs of Multimedia had 494 unique authors. As shown in Figure 10, we were able to identify Google Scholar accounts of 286 authors. 162 of these accounts were identified automatically using the provided author information: name, affiliation, and e-mail domain. 67 authors were already identified in the previous iterations of ConfFlow. We then manually analyzed the remaining 265 authors that were either tagged as ambiguous matches by the automatic process or returned no matches at all. We were able to identify an additional 57 accounts with the manual search. 

Figure 10. Author statistics for ICMR ‘21

None of the users claimed their ConfFlow account during ICMR’21. Figure 11 shows the distribution of the number of papers MMSys authors published in the last two years. It is interesting that despite being almost double the size of MMSys and 5 times smaller than Multimedia, 

Figure 11. Histogram of number of publications in the last 2 years for all identified authors of ICMR ‘21.

Discussion and Recommendations

This section describes some key points of reflection on the running of ConfFlow this year. 

One of the main issues relates to the low number of users despite conference participants being aware of the application. The survey on collaboration and experience with ConfFlow did not yield sufficient responses. 

It is interesting to see in all conferences that a significant proportion of the users of ConfFlow were newcomers. Unfortunately, without the statistics from the survey we put out, it is not clear if this reflects the distribution of the conference attendees in general or whether more newcomers are interested in using ConfFlow due to its promise of helping people to connect socially. 

The reasons for this could be multiple: The hybrid format and virtual formats of the conferences made it difficult to provide time to think about collaborations whilst being in the middle of preparing to go to a conference or during the conference itself. For virtual participants, in particular, the benefit of not going physically means that one can continue with day to day duties in the person’s normal job. However, this does take away opportunities for social networking that one might have in the in-person setting. In addition, the challenges of running the conference in the hybrid format may also have led to fatigue for in-person as well as virtual participants. Another possible explanation is that in the general Multimedia community there is no obvious intrinsic value in changing the way collaboration is already carried out. The additional barrier of needing to claim their account due to privacy and ethical reasons may have been confusing (it could appear that an account needs to be created, which can be a barrier to usage). 

We reflect that the fact that more users were obtained for MMSys could have been related to the closer access we had to social media channels e.g. the conference slack channel, which helped to keep a centralized reminder for participants of what was going on in the conference. It could also be a reflection of the openness of the community to finding social connections. On the other hand, the Whova app used for MM is a more complex interface with multiple purposes beyond just communication, which may have made it harder for attendees to see the ConfLab announcement, embedded in other announcements.

Finally, we also considered that the ConfFlow interface takes time to browse and reflect on. Given that the intrinsic value of the application is not immediately obvious to many (this is our interpretation of the low interest in application use). It could make more sense to have a SIGMM  community-wide edition of ConfFlow that is available all year round, allowing for the dissemination of the application and its purpose to be made clear outside of the pre-conference rush. Then conference-specific editions could be generated. This, however, comes with its own logistic issues as every new identity added to the database would either require the entire embedding to be recomputed, or their latent research interest representation would need to be projected directly onto the existing embedding, which does not necessarily accurately represent their closeness to others in the existing database. The rate at which updates (new authors) are added would also require significant manual attention (and may not be easy to resolve as shown in the statistics in Table 1). Given also the popularity of the Influence Flowers (http://influencemap.ml/), a previously funded SIGMM initiative, we suspect that a more ego-based strategy may be more effective in encouraging researchers in the community to start engaging with the ConfFlow application.

ConfLab Factors\ Conference: MMSys MultimediaICMR
#authors2722642494
#previously identified authors0225286
#authors with automatically identifiable Google scholar158121367
#authors without Google Scholar Match131204265
#authors with manually identified Google Scholar.1317057
#users18160
#survey respondents100

Table 1.  Summary statistics for each of the three conferences.

Conclusions

The ConfFlow 2021 edition generated new functionalities to allow researchers to browse their research interests with respect to others in a fun and novel way. More effort was given this year to improve the advertising of the application and to try and understand the community’s struggles with collaboration. Steps were also taken to make the running of ConfFlow less labour-intensive. 

Our conclusions from the many efforts made in ConfFlow 2021, the surrounding social media presence, and the survey is that for the SIGMM population at large, encouraging more social connections outside of the normal routes is unfortunately not perceived to have significant value. It seems that for now, more immediate forms of social interaction encouragement e.g. initiatives during the conference to help newcomers to integrate may be a more effective route to enable social integration. Another option is to consider a hybrid approach where ConfFlow can be used to e.g. identify groups for going to dinner together during the conference or sitting at the same table during the conference banquet. However, this would still require a sufficient uptake of the application. Given the myriad of different motivations community members have to attend conferences, it remains an intriguing and open challenge to encourage more diverse research output from this highly interdisciplinary community. 

Acknowledgements:

ConfFlow 2021 was supported in part by the SIGMM Special Initiatives Fund and the Dutch NWO-funded MINGLE project number 639.022.606. We thank users who gave feedback on the application during prototyping and implementation and the General Chairs of ACM MMSys, Multimedia, and ICMR 2021 for their support.

References:

Ekin Gedik and Hayley Hung. 2020. ConfFlow: A Tool to Encourage New Diverse Collaborations. Proceedings of the 28th ACM International Conference on Multimedia. Association for Computing Machinery, New York, NY, USA, 4562–4564. DOI:https://doi.org/10.1145/3394171.3414459

Appendix:

List of Survey Questions used for our google form:

https://docs.google.com/forms/d/e/1FAIpQLSdcj1B-fOFmEG8mFvcUbd91ysYkEapm_zVvNcJMaFS5ETgFkQ/viewform

  • Context Questions
    • I am attending these conferences in 2021
    • I am publishing in these conferences in 2021
    • Please indicate the job description that best describes you.
  • General Questions about Scientific Collaboration
    • I tend to initiate collaborations with people I already know well.
    • I tend to initiate collaborations with people at the same experience level as me.
    • I am very interested in finding collaborators from a different discipline.
    • I find it very hard to identify relevant collaborators from a different discipline.
    • I find it very hard to initiate interdisciplinary collaborations even when I know who I want to work with.
    • What are the common problems you face when trying to initiate a collaboration?
    • Do these problems influence how or whether you initiate collaborations?
  • Initial contact with ConfFlow:
    • I saw announcements encouraging me to try ConfFlow
    • Did you have problems in getting in to ConfFlow? e.g. the system could not find your Google Scholar account?
    • On how many separate occasions have you used ConfFlow?
  • Motivation for using ConfFlow
    • I did not use ConfFlow because I did not have time.
    • I did not use ConfFlow because I did not find it interesting.
    • I would be interested in trying ConfFlow in the weeks leading up to or following a conference.
    • Despite not using ConfFlow, I could see how it might help advance my research work.
    • We would be very grateful for any comments or feedback on your experience of ConfFlow so we can make it more useful. Please feel free to share any remarks you might have on this topic.
  • Experience using ConfFlow
    • The visualization matched who I would expect to be close to me.
    • The visualization matched who I would expect to be far away from me.
    • ConfFlow helped me to find interesting people that I did not know before.
    • ConfFlow helped me to connect with interesting people that I did not know before.
    • ConfFlow encouraged me to think more deliberately about making connections with researchers in a different discipline.
    • I think that ConfFlow could help to advance my research work.

VQEG Column: VQEG Meeting Dec. 2021 (virtual/online)

Introduction

Welcome to a new column on the ACM SIGMM Records from the Video Quality Experts Group (VQEG).
The last VQEG plenary meeting took place from 13 to 17 December 2021, and it was organized online by University of Surrey, UK. During five days, more than 100 participants (from more than 20 different countries of America, Asia, Africa, and Europe) could remotely attend the multiple sessions related to the active VQEG projects, which included more than 35 presentations and interesting discussions. This column provides an overview of this VQEG plenary meeting, while all the information, minutes and files (including the presented slides) from the meeting are available online in the VQEG meeting website.

Group picture of the VQEG Meeting 13-17 December 2021

Many of the works presented in this meeting can be relevant for the SIGMM community working on quality assessment. Particularly interesting can be the new analyses and methodologies discussed within the Statistical Analyses Methods group, the new metrics and datasets presented within the No-Reference Metrics group, and the progress on the plans of the 5G Key Performance Indicators group and the Immersive Media group. We encourage those readers interested in any of the activities going on in the working groups to check their websites and subscribe to the corresponding reflectors, to follow them and get involved.

Overview of VQEG Projects

Audiovisual HD (AVHD)

The AVHD group investigates improved subjective and objective methods for analyzing commonly available video systems. In this sense, it has recently completed a joint project between VQEG and ITU SG12 in which 35 candidate objective quality models were submitted and evaluated through extensive validation tests. The result was the ITU-T Recommendation P.1204, which includes three standardized models: a bit-stream model, a reduced reference model, and a hybrid no-reference model. The group is currently considering extensions of this standard, which originally covered H.264, HEVC, and VP9, to include other encoders, such as AV1. Apart from this, two other projects are active under the scope of AVHD: QoE Metrics for Live Video Streaming Applications (Live QoE) and Advanced Subjective Methods (AVHD-SUB).

During the meeting, three presentations related to AVHD activities were provided. In the first one, Mikolaj Leszczuk (AGH University) presented their work on secure and reliable delivery of professional live transmissions with low latency, which brought to the floor the constant need for video datasets, such as the VideoSet. In addition, Andy Quested (ITU-R Working Party 6C) led a discussion on how to assess video quality for very high resolution (e.g., 8K, 16K, 32K, etc.) monitors with interactive applications, which raised the discussion on the key possibility of zooming in to absorb the details of the images without pixelation. Finally, Abhinau Kumar (UT Austin) and Cosmin Stejerean (Meta) presented their work on exploring the reduction of the complexity of VMAF by using features in the wavelet domain [1]. 

Quality Assessment for Health applications (QAH)

The QAH group works on the quality assessment of health applications, considering both subjective evaluation and the development of datasets, objective metrics, and task-based approaches. This group was recently launched and, for the moment, they have been working on a topical review paper on objective quality assessment of medical images and videos, which was submitted in December to Medical Image Analysis [2]. Rafael Rodrigues (Universidade da Beira Interior) and Lucie Lévêque (Nantes Université) presented the main details of this work in a presentation scheduled during the QAH session. The presentation also included information about the review paper published by some members of the group on methodologies for subjective quality assessment of medical images [3] and the efforts in gathering datasets to be listed on the VQEG datasets website. In addition, Lu Zhang (IETR – INSA Rennes) presented her work on model observers for the objective quality assessment of medical images from task-based approaches, considering three tasks: detection, localization, and characterization [4]. In addition, it is worth noting that members of this group are organizing a special session on “Quality Assessment for Medical Imaging” at the IEEE International Conference on Image Processing (ICIP) that will take place in Bordeaux (France) from the 16 to the 19 October 2022.

Statistical Analysis Methods (SAM)

The SAM group works on improving analysis methods both for the results of subjective experiments and for objective quality models and metrics. Currently, they are working on statistical analysis methods for subjective tests, which are discussed in their monthly meetings.

In this meeting, there were four presentations related to SAM activities. In the first one, Zhi Li and Lukáš Krasula (Netflix), exposed the lessons they learned from the subjective assessment test carried out during the development of their metric Contrast Aware Multiscale Banding Index (CAMBI) [5]. In particular, they found that some subjective can have perceptually unbalanced stimuli, which can cause systematic and random errors in the results. In this sense, they explained their statistical data analyses to mitigate these errors, such as the techniques in ITU-T Recommendation P.913 (section 12.6) which can reduce the effects of the random error. The second presentation described the work by Pablo Pérez (Nokia Bell Labs), Lucjan Janowsk (AGH University), Narciso Garcia (Universidad Politécnica de Madrid), and Margaret H. Pinson (NTIA/ITS) on a novel subjective assessment methodology with few observers with repetitions (FOWR) [6]. Apart from the description of the methodology, the dataset generated from the experiments is available on the Consumer Digital Video Library (CDVL). Also, they launched a call for other labs to repeat their experiments, which will help on discovering the viability, scope and limitations of the FOWR method and, if appropriate, include this method in the ITU-T Recommendation P.913 for quasi-experimental assessments when it is not possible to have 16 to 24 subjects (e.g., pre-tests, expert assessment, and resource limitations), for example, performing the experiment with 4 subjects 4 times each on different days, which would be similar to a test with 15 subjects. In the third presentation, Irene Viola (CWI) and Lucjan Janowski (AGH University) presented their analyses on the standardized methods for subject removal in subjective tests. In particular, the methods proposed in the recommendations ITU-R BT.500 and ITU-T P.913 were considered, resulting in that the first one (described in Annex 1 of Part 1) is not recommended for Absolute Category Rating (ACR) tests, while the one described in the second recommendations provides good performance, although further investigation in the correlation threshold used to discard subjects s required. Finally, the last presentation led the discussion on the future activities of SAM group, where different possibilities were proposed, such as the analysis of confidence intervals for subjective tests, new methods for comparing subjective tests from more than two labs, how to extend these results to better understand the precision of objective metrics, and research on crowdsourcing experiment in order to make them more reliable and improve cost-effectiveness. These new activities are discussed in the monthly meetings of the group.

Computer Generated Imagery (CGI)

CGI group focuses on quality analysis of computer-generated imagery, with a focus on gaming in particular. Currently, the group is working on topics related to ITU work items, such as ITU-T Recommendation P.809 with the development of a questionnaire for interactive cloud gaming quality assessment, ITU-T Recommendation P.CROWDG related to quality assessment of gaming through crowdsourcing, ITU-T Recommendation P.BBQCG with a bit-stream based quality assessment of cloud gaming services, and a codec comparison for computer-generated content. In addition, a presentation was delivered during the meeting by Nabajeet Barman (Kingston University/Brightcove), who presented the subjective results related to the work presented at the last VQEG meeting on the use of LCEVC for Gaming Video Streaming Applications [7]. For more information on the related activities, do not hesitate to contact the chairs of the group. 

No Reference Metrics (NORM)

The NORM group is an open collaborative project for developing no-reference metrics for monitoring visual service quality. Currently, two main topics are being addressed by the group, which are discussed in regular online meetings. The first one is related to the improvement of SI/TI metrics to solve ambiguities that have appeared over time, with the objective of providing reference software and updating the ITU-T Recommendation P.910. The second item is related to the addition of standard metadata of video quality assessment-related information in the encoded video streams. 

In this meeting, this group was one of the most active in terms of presentations on related topics, with 11 presentations. Firstly, Lukáš Krasula (Netflix) presented their Contrast Aware Multiscale Banding Index (CAMBI) [5], an objective quality metric that addresses banding degradations that are not detected by other metrics, such as VMAF and PSNR (code is available on GitHub). Mikolaj Leszczuk (AGH University) presented their work on the detection of User-Generated Content (UGC) automatic detection in the wild. Also, Vignesh Menon & Hadi Amirpour (AAU Klagenfurt) presented their open-source project related to the analysis and online prediction of video complexity for streaming applications. Jing Li (Alibaba) presented their work related to the perceptual quality assessment of internet videos [8], proposing a new objective metric (STDAM, for the moment, used internally) validated in the Youku-V1K dataset. The next presentation was delivered by Margaret Pinson (NTIA/ITS) dealing with a comprehensive analysis on why no-reference metrics fail, which emphasized the need of training these metrics on several datasets and test them on larger ones. The discussion also pointed out the recommendation for researchers to publish their metrics in open source in order to make it easier to validate and improve them. Moreover, Balu Adsumilli and Yilin Wang (Youtube) presented a new no-reference metric for UGC, called YouVQ, based on a transfer-learning approach with a pre-train on non-UGC data and a re-train on UGC. This metric will be released in open-source shortly, and a dataset with videos and subjective scores has been also published. Also, Margaret Pinson (NTIA/ITS), Mikołaj Leszczuk (AGH University), Lukáš Krasula (Netflix), Nabajeet Barman (Kingston University/Brightcove), Maria Martini (Kingston University), and Jing Li (Alibaba) presented a collection of datasets for no-reference metric research, while Shahid Satti (Opticom GmbH) exposed their work on encoding complexity for short video sequences. On his side, Franz Götz-Hahn (Universität Konstanz/Universität Kassel) presented their work on the creation of the KonVid-150k video quality assessment dataset [9], which can be very valuable for training no-reference metrics, and the development of objective video quality metrics. Finally, regarding the aforementioned two active topics within NORM group, Ioannis Katsavounidis (Meta) provided a presentation on the advances in relation to the activity related to the inclusion of standard video quality metadata, while Lukáš Krasula (Netflix), Cosmin Stejerean (Meta), and Werner Robitza (AVEQ/TU Ilmenau) presented the updates on the improvement of SI/TI metrics for modern video systems.

Joint Effort Group (JEG) – Hybrid

The JEG group was focused on joint work to develop hybrid perceptual/bitstream metrics and on the creation of a large dataset for training such models using full-reference metrics instead of subjective metrics. In this sense, a project in collaboration with Sky was finished and presented in the last VQEG meeting.

Related activities were presented in this meeting. In particular, Enrico Masala and Lohic Fotio Tiotsop (Politecnico di Torino) presented the updates on the recent activities carried out by the group, and their work on artificial-intelligence observers for video quality evaluation [10].

Implementer’s Guide for Video Quality Metrics (IGVQM)

The IGVQM group, whose activity started in the VQEG meeting in December 2020, works on creating an implementer’s guide for video quality metrics. In this sense, the current goal is to create a report on the accuracy of video quality metrics following a test plan based on collecting datasets, collecting metrics and methods for assessment, and carrying out statistical analyses. An update on the advances was provided by Ioannis Katsavounidis (Meta) and a call for the community is open to contribute to this activity with datasets and metrics.

5G Key Performance Indicators (5GKPI)

The 5GKPI group studies relationship between key performance indicators of new communications networks (especially 5G) and QoE of video services on top of them. Currently, the group is working on the definition of relevant use cases, which are discussed on monthly audiocalls. 

In relation to these activities, there were four presentations during this meeting. Werner Robitza (AVQ/TU Ilmenau) presented a proposal for KPI message format for gaming QoE over 5G networks. Also, Pablo Pérez (Nokia Bell Labs) presented their work on a parametric quality model for teleoperated driving [11] and an update of the ITU-T GSTR-5GQoE topic, related to the QoE requirements for real-time multimedia services over 5G networks. Finally, Margaret Pinson (NTIA/ITS) presented an overall description of 5G technology, including differences in spectrum allocation per country impact on the propagation and responsiveness and throughput of 5G devices.

Immersive Media Group (IMG)

The IMG group researches on quality assessment of immersive media. The group recently finished the test plan for quality assessment of short 360-degree video sequences, which resulted in the support for the development of the ITU-T Recommendation P.919. Currently, the group is working on further analyses of the data gathered from the subjective tests carried out for that test plan and on the analysis of data for the quality assessment of long 360-degree videos. In addition, members of the group are contributing to the IUT-T SG12 on the topic G.CMVTQS on computational models for QoE/QoS monitoring to assess video telephony services. Finally, the group is also working on the preparation of a test plan for evaluating the QoE with immersive and interactive communication systems, which was presented by Pablo Pérez (Nokia Bell Labs) and Jesús Gutiérrez (Universidad Politécnica de Madrid). If the reader is interested in this topic, do not hesitate to contact them to join the effort. 

During the meeting, there were also four presentations covering topics related to the IMG topics. Firstly, Alexander Raake (TU Ilmenau) provided an overview of the projects within the AVT group dealing with the QoE assessment of immersive media. Also, Ashutosh Singla (TU Ilmenau) presented a 360-degree video database with higher-order ambisonics spatial audio. Maria Martini (Kingston University) presented an update on the IEEE standardization activities on Human Factors or Visual Experiences (HFVE), such as the recently submitted draft standard on deep-learning-based quality assessment and the draft standard to be submitted shortly on quality assessment of light field content. Finally, Kjell Brunnstöm (RISE) presented their work on legibility in virtual reality, also addressing the perception of speech-to-text by Deaf and hard of hearing.  

Intersector Rapporteur Group on Audiovisual Quality Assessment (IRG-AVQA) and Q19 Interim Meeting

Although in this case there was no official meeting IRG-AVQA meeting, there were various presentations related to ITU activities addressing QoE evaluation topics. In this sense, Chulhee Lee (Yonsei University) presented an overview of ITU-R activities, with a special focus on quality assessment of HDR content, and together with Alexander Raake (TU Ilmenau) presented an update on ongoing ITU-T activities.

Other updates

All the sessions of this meeting and, thus, the presentations, were recorded and have been uploaded to Youtube. Also, it is worth informing that the anonymous FTP will be closed soon, so files and presentations can be accessed from old browsers or via an FTP app. All the files, including those corresponding to the VQEG meetings, will be embedded into the VQEG website over the next months. In addition, the GitHub with tools and subjective labs setup is still online and kept updated. Moreover, during this meeting, it was decided to close the Joint Effort Group (JEG) and the Independent Lab Group (ILG), which can be re-established when needed. Finally, although there were not many activities in this meeting within the Quality Assessment for Computer Vision Applications (QACoViA) and the Psycho-Physiological Quality Assessment (PsyPhyQA) they are still active.

The next VQEG plenary meeting will take place in Rennes (France) from 9 to 13 May 2022, which will be again face-to-face after four online meetings.

References

[1] A. K. Venkataramanan, C. Stejerean, A. C. Bovik, “FUNQUE: Fusion of Unified Quality Evaluators”, arXiv:2202.11241, submitted to the IEEE International Conference on Image Processing (ICIP), 2022. (opens in a new tab).
[2] R. Rodrigues, L. Lévêque, J. Gutiérrez, H. Jebbari, M. Outtas, L. Zhang, A. Chetouani, S. Al-Juboori, M. G. Martini, A. M. G. Pinheiro, “Objective Quality Assessment of Medical Images and Videos: Review and Challenges”, submitted to the Medical Image Analysis, 2022.
[3] L. Lévêque, M. Outtas, L. Zhang, H. Liu, “Comparative study of the methodologies used for subjective medical image quality assessment”, Physics in Medicine & Biology, vol. 66, no. 15, Jul. 2021. (opens in a new tab).
[4] L.Zhang, C.Cavaro-Ménard, P.Le Callet, “An overview of model observers”, Innovation and Research in Biomedical Engineering, vol. 35, no. 4, pp. 214-224, Sep. 2014. (opens in a new tab).
[5] P. Tandon, M. Afonso, J. Sole, L. Krasula, “Comparative study of the methodologies used for subjective medical image quality assessment”, Picture Coding Symposium (PCS), Jul. 2021. (opens in a new tab).
[6] P. Pérez, L. Janowski, N. García, M. Pinson, “Subjective Assessment Experiments That Recruit Few Observers With Repetitions (FOWR)”, IEEE Transactions on Multimedia (Early Access), Jul. 2021. (opens in a new tab).
[7] N. Barman, S. Schmidt, S. Zadtootaghaj, M.G. Martini, “Evaluation of MPEG-5 part 2 (LCEVC) for live gaming video streaming applications”, Proceedings of the Mile-High Video Conference, Mar. 2022. (opens in a new tab).
[8] J. Xu, J. Li, X. Zhou, W. Zhou, B. Wang, Z. Chen, “Perceptual Quality Assessment of Internet Videos”, Proceedings of the ACM International Conference on Multimedia, Oct. 2021. (opens in a new tab).
[9] F. Götz-Hahn, V. Hosu, H. Lin, D. Saupe, “KonVid-150k: A Dataset for No-Reference Video Quality Assessment of Videos in-the-Wild”, IEEE Access, vol. 9, pp. 72139 – 72160, May. 2021. (opens in a new tab).
[10] L. F. Tiotsop, T. Mizdos, M. Barkowsky, P. Pocta, A. Servetti, E. Masala, “Mimicking Individual Media Quality Perception with Neural Network based Artificial Observers”, ACM Transactions on Multimedia Computing, Communications, and Applications, vol. 18, no. 1, Jan. 2022. (opens in a new tab).
[11] P. Pérez, J. Ruiz, I. Benito, R. López, “A parametric quality model to evaluate the performance of tele-operated driving services over 5G networks”, Multimedia Tools and Applications, Jul. 2021. (opens in a new tab).

What is the trade-off between CO2 emission and video-conferencing QoE?

It is a natural thing that users of multimedia services want to have the highest possible Quality of Experience (QoE), when using said services. This is especially so in contexts such as video-conferencing and video streaming services, which are nowadays a large part of many users’ daily life, be it work-related Zoom calls, or relaxing while watching Netflix. This has implications in terms of the energy consumed for the provision of those services (think of the cloud services involved, the networks, and the users’ own devices), and therefore it also has an impact on the resulting CO₂ emissions. In this column, we look at the potential trade-offs involved between varying levels of QoE (which for video services is strongly correlated with the bit rates used), and the resulting CO₂ emissions. We also look at other factors that should be taken into account when making decisions based on these calculations, in order to provide a more holistic view of the environmental impact of these types of services, and whether they do have a significant impact.

Energy Consumption and CO2 Emissions for Internet Service Delivery

Understanding the footprint of Internet service delivery is a challenging task. On one hand, the infrastructure and software components involved in the service delivery need to be known. For a very fine-grained model, this requires knowledge of all components along the entire service delivery chain: end-user devices, fixed or mobile access network, core network, data center and Internet service infrastructure. Furthermore, the footprint may need to consider the CO₂ emissions for producing and manufacturing the hardware components as well as the CO₂ emissions during runtime. Life cycle assessment is then necessary to obtain CO₂ emission per year for hardware production. However, one may argue that the infrastructure is already there and therefore the focus will be on the energy consumption and CO₂ emission during runtime and delivery of the services. This is also the approach we follow here to provide quantitative numbers of energy consumption and CO₂ emission for Internet-based video services. On the other hand, quantitative numbers are needed beyond the complexity of understanding and modelling the contributors to energy consumption and C02 emission.

To overcome this complexity, the literature typically considers key figures on the overall data traffic and service consumption times aggregated over users and services over a longer period of time, e.g., one year. In addition, the total energy consumption of mobile operators and data centres is considered. Together with the information on e.g., the number of base station sites, this gives some estimates, e.g., on the average power consumption per site or the average data traffic per base station site [Feh11]. As a result, we obtain measures such as energy per bit (Joule/bit) determining the energy efficiency of a network segment. In [Yan19], the annual energy consumption of Akamai is converted to power consumption and then divided by the maximum network traffic, which results again in the energy consumption per bit of Akamai’s data centers. Knowing the share of energy sources (nonrenewable energy, including coal, natural gas, oil, diesel, petroleum; renewable energy including solar, geothermal, wind energy, biomass, hydropower from flowing water), allows relating the energy consumption to the total CO₂ emissions. For example, the total contribution from renewables exceeded 40% in 2021 in Germany and Finland, Norway has about 60%, Croatia about 36% (statistics from 2020).

A detailed model of the total energy consumption of mobile network services and applications is provided in [Yan19]. Their model structure considers important factors from each network segment from cloud to core network, mobile network, and end-user devices. Furthermore, service-specific energy consumption are provided. They found that there are strong differences between the service type and the emerging data traffic pattern. However, key factors are the amount of data traffic and the duration of the services. They also consider different end-to-end network topologies (user-to-data center, user-to-user via data center, user-to-user and P2P communication). Their model of the total energy consumption is expressed as the sum of the energy consumption of the different segments:

  • Smartphone: service-specific energy depends among others on the CPU usage and the network usage e.g. 4G over the duration of use,
  • Base station and access network: data traffic and signalling traffic over the duration of use,
  • Wireline core network: service specific energy consumption of a mobile service taking into account the data traffic volume and the energy per bit,
  • Data center: energy per bit of the data center is multiplied by data traffic volume of the mobile service.

The Shift Project [TSP19] provides a similar model which is called the “1 Byte Model”. The computation of energy consumption is transparently provided in calculation sheets and discussed by the scientific community. As a result of the discussions [Kam20a,Kam20b], an updated model was released [TSP20] clarifying a simple bit/byte conversion issue. The suggested models in [TSP20, Kam20b] finally lead to comparable numbers in terms of energy consumption and CO₂ emission. As a side remark: Transparency and reproducibility are key for developing such complex models!

The basic idea of the 1 Byte Model for computing energy consumption is to take into account the time t of Internet service usage and the overall data volume v. The time of use is directly related to the energy consumption of the display of an end-user device, but also for allocating network resources. The data volume to transmit through the network, but also to generate or process data for cloud services, drives the energy consumption additionally. The model does not differentiate between Internet services, but they will result in different traffic volumes over the time of use. Then, for each segment i (device, network, cloud) a linear model E_i(t,v)=a_i * t + b_i * v + c_i is provided to quantify the energy consumption. To be more precise, the different coefficients are provided for each segment by [TSP20]. The overall energy consumption is then E_total = E_device + E_network + E_cloud.

CO₂ emission is then again a linear model of the total energy consumption (over the time of use of a service), which depends on the share of nonrenewable and renewable energies. Again, The Shift Project derives such coefficients for different countries and we finally obtain CO2 = k_country * E_total.

The Trade-off between QoE and CO2 Emissions

As a use case, we consider hosting a scientific conference online through video-conferencing services. Assume there are 200 conference participants attending the video-conferencing session. The conference lasts for one week, with 6 hours of online program per day.  The video conference software requires the following data rates for streaming the sessions (video including audio and screen sharing):

  • high-quality video: 1.0 Mbps
  • 720p HD video: 1.5 Mbps
  • 1080p HD video: 3 Mbps

However, group video calls require even higher bandwidth consumption. To make such experiences more immersive, even higher bit rates may be necessary, for instance, if using VR systems for attendance.

A simple QoE model may map the video bit rate of the current video session to a mean opinion score (MOS). [Lop18] provides a logistic regression MOS(x) depending on the video bit rate x in Mbps: f(x) = m_1 log x + m_2

Then, we can connect the QoE model with the energy consumption and CO₂ emissions model from above in the following way. We assume a user attending the conference for time t. With a video bit rate x, the emerging data traffic is v = x*t. Those input parameters are now used in the 1 Byte Model for a particular device (laptop, smartphone), type of network (wired, wifi, mobile), and country (EU, US, China).

Figure 1 shows the trade-off between the MOS and energy consumption (left y-axis). The energy consumption is mapped to CO₂ emission by assuming the corresponding parameter for the EU, and that the conference participants are all connected with a laptop. It can be seen that there is a strong increase in energy consumption and CO₂ emission in order to reach the best possible QoE. The MOS score of 4.75 is reached if a video bit rate of roughly 11 Mbps is used. However, with 4.5 Mbps, a MOS score of 4 is already reached according to that logarithmic model. This logarithmic behaviour is a typical observation in QoE and is connected to the Weber-Fechner law, see [Rei10]. As a consequence, we may significantly save energy and CO₂ when not providing the maximum QoE, but “only” good quality (i.e., MOS score of 4). The meaning of the MOS ratings is 5=Excellent, 4=Good, 3=Fair, 2=Poor, 1=Bad quality.

Figure 1: Trade-off between MOS and energy consumption or CO2 emission.

Figure 2, therefore, visualized the gain when delivering the video in lower quality and lower video bit rates. In fact, the gain compared to the efforts for MOS 5 are visualized. To get a better understanding of the meaning of those CO₂ numbers, we express the CO₂ gain now in terms of thousands of kilometers driving by car. Since the CO₂ emission depends on the share of renewable energies, we may consider different countries and the parameters as provided in [TSP20]. We see that ensuring each conference participant a MOS score of 4 instead of MOS 5 results in savings corresponding to driving approximately 40000 kilometers by car assuming the renewable energy share in the EU – this is the distance around the Earth! Assuming the energy share in China, this would save more than 90000 kilometers. Of course, you could also save 90 000 kilometers by walking – which requires however about 2 years non-stop with a speed of 5 km/h. Note that this large amount of CO₂ emission is calculated assuming a data rate of 15 Mbps over 5 days (and 6 hours per day), resulting in about 40.5 TB of data that needs to be transferred to the 200 conference participants.

Figure 2: Relating the CO2 emission in different countries for achieving this MOS to the distance by travelling in a car (in thousands of kilometers).

Discussions

Raising awareness of CO₂ emissions due to Internet service consumption is crucial. The abstract CO₂ emission numbers may be difficult to understand, but relating this to more common quantities helps to understand the impact individuals have. Of course, the provided numbers only give an impression, since the models are very simple and do not take into account various facets. However, the numbers nicely demonstrate the potential trade-off between QoE of end-users and sustainability in terms of energy consumption and CO₂ emission. In fact, [Gna21] conducted qualitative interviews and found that there is a lack of awareness of the environmental impact of digital applications and services, even for digital natives. In particular, an underlying issue is that there is a lack of understanding among end-users as to how Internet service delivery works, which infrastructure components play a role and are included along the end-to-end service delivery path, etc. Hence, the environmental impact is unclear for many users. Our aim is thus to contribute to overcoming this issue by raising awareness on this matter, starting with simplified models and visualizations.

[Gna21] also found that users indicate a certain willingness to make compromises between their digital habits and the environmental footprint. Given global climate changes and increased environmental awareness among the general population, such a trend in willingness to make compromises may be expected to further increase in the near future. Hence, it may be interesting for service providers to empower users to decide their environmental footprint at the cost of lower (yet still satisfactory) quality. This will also reduce the costs for operators and seems to be a win-win situation if properly implemented in Internet services and user interfaces.

Nevertheless, tremendous efforts are also currently being undertaken by Internet companies to become CO₂ neutral in the future. For example, Netflix claims in [Netflix2021] that they plan to achieve net-zero greenhouse gas emissions by the close of 2022. Similarly, also economic, societal, and environmental sustainability is seen as a key driver for 6G research and development [Mat21]. However, the time horizon is on a longer scope, e.g., a German provider claims they will reach climate neutrality for in-house emissions by 2025 at the latest and net-zero from production to the customer by 2040 at the latest [DT21]. Hence, given the urgency of the matter, end-users and all stakeholders along the service delivery chain can significantly contribute to speeding up the process of ultimately achieving net-zero greenhouse gas emissions.

References

  • [TSP19] The Shift Project, “Lean ict: Towards digital sobriety,” directed by Hugues Ferreboeuf, Tech. Rep., 2019, last accessed: March 2022. Available online (last accessed: March 2022)
  • [Yan19] M. Yan, C. A. Chan, A. F. Gygax, J. Yan, L. Campbell,A. Nirmalathas, and C. Leckie, “Modeling the total energy consumption of mobile network services and applications,” Energies, vol. 12, no. 1, p. 184, 2019.
  • [TSP20] Maxime Efoui Hess and Jean-Noël Geist, “Did The Shift Project really overestimate the carbon footprint of online video? Our analysis of the IEA and Carbonbrief articles”, The Shift Project website, June 2020, available online (last accessed: March 2022) PDF
  • [Kam20a] George Kamiya, “Factcheck: What is the carbon footprint of streaming video on Netflix?”, CarbonBrief website, February 2020. Available online (last accessed: March 2022)
  • [Kam20b] George Kamiya, “The carbon footprint of streaming video: fact-checking the headlines”, IEA website, December 2020. Available online (last accessed: March 2022)
  • [Feh11] Fehske, A., Fettweis, G., Malmodin, J., & Biczok, G. (2011). The global footprint of mobile communications: The ecological and economic perspective. IEEE communications magazine, 49(8), 55-62.
  • [Lop18]  J. P. López, D. Martín, D. Jiménez, and J. M. Menéndez, “Prediction and modeling for no-reference video quality assessment based on machine learning,” in 2018 14th International Conference on Signal-Image Technology & Internet-Based Systems (SITIS), IEEE, 2018, pp. 56–63.
  • [Gna21] Gnanasekaran, V., Fridtun, H. T., Hatlen, H., Langøy, M. M., Syrstad, A., Subramanian, S., & De Moor, K. (2021, November). Digital carbon footprint awareness among digital natives: an exploratory study. In Norsk IKT-konferanse for forskning og utdanning (No. 1, pp. 99-112).
  • [Rei10] Reichl, P., Egger, S., Schatz, R., & D’Alconzo, A. (2010, May). The logarithmic nature of QoE and the role of the Weber-Fechner law in QoE assessment. In 2010 IEEE International Conference on Communications (pp. 1-5). IEEE.
  • [Netflix21] Netflix: “Environmental Social Governance 2020”,  Sustainability Accounting Standards Board (SASB) Report, (2021, March). Available online (last accessed: March 2022)
  • [Mat21] Matinmikko-Blue, M., Yrjölä, S., Ahokangas, P., Ojutkangas, K., & Rossi, E. (2021). 6G and the UN SDGs: Where is the Connection?. Wireless Personal Communications, 121(2), 1339-1360.
  • [DT21] Hannah Schauff. Deutsche Telekom tightens its climate targets (2021, January). Available online (last accessed: March 2022)

JPEG Column: 94th JPEG Meeting

IEC, ISO and ITU issue a call for proposals for joint standardization of image coding based on machine learning

The 94th JPEG meeting was held online from 17 to 21 January 2022. A major milestone has been reached at this meeting with the release of the final call for proposals under the JPEG AI project. This standard aims at the joint standardization of the first image coding standard based on machine learning by the IEC, ISO and ITU, offering a single stream, compact compressed domain representation, targeting both human visualization with significant compression efficiency improvement over image coding standards in common use at equivalent subjective quality and effective performance for image processing and computer vision tasks.

The JPEG AI call for proposals was issued in parallel with a call for proposals for point cloud coding based on machine learning. The latter will be conducted in parallel with JPEG AI standardization.

The 94th JPEG meeting had the following highlights:

  • JPEG AI Call for Proposals;
  • JPEG JPEG Pleno Point Cloud Call for Proposals;
  • JPEG Pleno Light Fields quality assessment;
  • JPEG AIC near perceptual lossless quality assessment;
  • JPEG Systems;
  • JPEG Fake Media draft Call for Proposals;
  • JPEG NFT exploration;
  • JPEG XS;
  • JPEG XL
  • JPEG DNA explorations.

The following provides an overview of the major achievements carried out during the 94th JPEG meeting.

JPEG AI

JPEG AI targets a wide range of applications such as cloud storage, visual surveillance, autonomous vehicles and devices, image collection storage and management, live monitoring of visual data and media distribution. The main objective is to design a coding solution that offers significant compression efficiency improvement over coding standards in common use at equivalent subjective quality and an effective compressed domain processing for machine learning-based image processing and computer vision tasks. Other key requirements include hardware/software implementation-friendly encoding and decoding, support for 8- and 10-bit depth, efficient coding of images with text and graphics and progressive decoding.

During the 94th JPEG meeting, several activities toward a JPEG AI learning-based coding standard have occurred, notably the release of the Final Call for Proposals for JPEG AI, consolidated with the definition of the Use Cases and Requirements and the Common Training and Test Conditions to assure a fair and complete evaluation of the future proposals.

The final JPEG AI Call for Proposals marks an important milestone being the first time that contributions are solicited towards a learning-based image coding solution. The JPEG AI proposals’ registration deadline is 25 February 2022. There are three main phases for proponents to submit materials, namely, on 10th March for the proposed decoder implementation with some fixed coding model, on 2nd May for the submission of proposals’ bitstreams and decoded images and/or labels for the test datasets, and on 18th July, for the submission of source code for the encoder, decoder, training procedure and the proposal description. The presentation and discussion of the JPEG AI proposals will occur during the 96th JPEG meeting. JPEG AI is a joint standardization project between IEC, ISO and ITU.

JPEG AI framework

JPEG Pleno Point Cloud Coding

JPEG Pleno is working towards the integration of various modalities of plenoptic content under a single and seamless framework. Efficient and powerful point cloud representation is a key feature of this vision. Point cloud data supports a wide range of applications for human and machine consumption including metaverse, autonomous driving, computer-aided manufacturing, entertainment, cultural heritage preservation, scientific research and advanced sensing and analysis. During the 94th JPEG meeting, the JPEG Committee released a final Call for Proposals on JPEG Pleno Point Cloud Coding. This call addresses learning-based coding technologies for point cloud content and associated attributes with emphasis on both human visualization and decompressed/reconstructed domain 3D processing and computer vision with competitive compression efficiency compared to point cloud coding standards in common use, with the goal of supporting a royalty-free baseline. This Call was released in conjunction with new releases of the JPEG Pleno Point Cloud Use Cases and Requirements and the JPEG Pleno Point Cloud Common Training and Test Conditions. Interested parties are invited to register for this Call by the deadline of the 31st of March 2022.

JPEG Pleno Light Field

Besides defining coding standards, JPEG Pleno is planning for the creation of quality assessment standards, i.e. defining a framework including subjective quality assessment protocols and objective quality assessment measures for lossy decoded data of plenoptic modalities in the context of multiple use cases. The first phase of this effort will address the light field modality and should build on the light field quality assessment tools developed by JPEG in recent years. Future activities will focus on holographic and point cloud modalities, for both of which also coding related standardization efforts have been initiated.

JPEG AIC

During the 94th JPEG Meeting, the first version of the use cases and requirements document was released under the Image Quality Assessment activity. The standardization process was also defined, and the process will be carried out in two phases: during Stage I, a subjective methodology for the assessment of images with visual quality in the range from high quality to near-visually lossless will be standardized, following a collaborative process; successively, in Stage II, an objective image quality metric will be standardized, by means of a competitive process. A tentative timeline has also been planned with a call for contributions for subjective quality assessment methodologies to be released in July 2022, and a call for proposals for an objective quality metric planned in July 2023.

JPEG Systems

JPEG Systems produced the FDIS text for JLINK (ISO/IEC 19566-7), which allows the storage of multiple images inside JPEG files and the interactive navigation between them. This enables features like virtual museum tours, real estate visits, hotspot zoom into other images and many others. For JPEG Snack, the Committee produced the DIS text of ISO/IEC 19566-8, which allows storing multiple images for self-running multimedia experiences like animated image sequences and moving image overlays. Both texts are submitted for respective balloting. For JUMBF (ISO/IEC 19566-5, JPEG Universal Metadata Box Format), a second edition was initiated which combines the first edition and two amendments. Actual extensions are the support of CBOR (Concise Binary Object Representation) and private content types. In addition, JPEG Systems started an activity on a technical report for JPEG extensions mechanisms to facilitate forwards and backwards compatibility under ISO/IEC 19566-9. This technical report gives guidelines for the design of future JPEG standards and summarizes existing design mechanisms.

JPEG Fake Media

At its 94th meeting, the JPEG Committee released a Draft Call for Proposals for JPEG Fake Media and associated Use Cases and Requirements on JPEG Fake Media. These documents are the result of the work performed by the JPEG Fake Media exploration. The scope of JPEG Fake Media is the creation of a standard that can facilitate secure and reliable annotation of media asset creation and modifications. The standard shall address use cases that are both in good faith and those with malicious intent. The Committee targets the following timeline for the next steps in the standardization process:

  • April 2022: issue Final Call for Proposals
  • October 2022: evaluation of proposals
  • January 2023: first Working Draft (WD)
  • January 2024: Draft International Standard (DIS)
  • October 2024: International Standard (IS)

The JPEG Committee welcomes feedback on the JPEG Fake Media documents and invites interested experts to join the JPEG Fake Media AhG mailing list to get involved in this standardization activity.

JPEG NFT

The Ad hoc Group (AhG) on NFT resumed its exploratory work on the role of JPEG in the NFT ecosystem during the 94th JPEG meeting. Three use cases and four essential requirements were selected. The use cases include the usage of NFT for JPEG-based digital art, NFT for collectable JPEGs, and NFT for JPEG micro-licensing. The following categories of critical requirements are under consideration: metadata descriptions, metadata embedding and referencing; authentication and integrity; and the format for registering media assets. As a result, the JPEG Committee published an output document titled JPEG NFT Use Cases and Requirements. Additionally, the third JPEG NFT and Fake Media Workshop proceedings were published, and arrangements were made to hold another combined workshop between the JPEG NFT and JPEG Fake Media groups.

JPEG XS

At the 94th JPEG meeting a new revision of the Use Cases and Requirements for JPEG XS document was produced, as version 3.1, to clarify and improve the requirements of a frame buffer. In addition, the JPEG Committee reports that the second editions of Part 1 (Core coding system), Part 2 (Profiles and buffer models), and Part 3 (Transport and container formats) have been approved and are now scheduled for publication as International Standards. Lastly, the DAM text for Amendment 1 to JPEG XS Part 2, which contains the additional High420.12 profile and a new sublevel at 4 bpp, is ready and will be sent to final balloting for approval.

JPEG XL

JPEG XL Part 4 (Reference software) has proceeded to the FDIS stage. Work continued on the second edition of Part 1 (Core coding system). Core experiments were defined to investigate the numerical stability of the edge-preserving filter and fixed-point implementations. Both Part 1 (core coding system) and Part 2 (file format) are now published as IS, and preliminary support has been implemented in major web browsers, image viewing and editing software. Consequently, JPEG XL is now ready for wide-scale adoption.

JPEG DNA

The JPEG Committee has continued its exploration of the coding of images in quaternary representations, as is particularly suitable for DNA storage. The scope of JPEG DNA is the creation of a standard for efficient coding of images that considers biochemical constraints and offers robustness to noise introduced by the different stages of the storage process that is based on DNA synthetic polymers. A new version of the JPEG DNA overview document was issued and is now publicly available. It was decided to continue this exploration by validating and extending the JPEG DNA experimentation software to simulate an end-to-end image storage pipeline using DNA for future exploration experiments including biochemical noise simulation. During the 94th JPEG meeting, the JPEG DNA committee initiate a new document describing the Common Test Conditions that should be used to evaluate different aspects of image coding for storage on DNA support. It was also decided to prepare an outreach video to explain DNA coding as well as organize the 6th workshop on JPEG DNA with emphasis on the biochemical process noise simulators. Interested parties are invited to consider joining the effort by registering on the mailing list of JPEG DNA AhG.

Final Quote

“JPEG marks a historical milestone with the parallel release of two calls for proposals for learning based coding of images and point clouds,” said Prof. Touradj Ebrahimi, the Convenor of the JPEG Committee.

Upcoming JPEG meetings are planned as follows:

  • No 95, will be held online during 25-29 April 2022

MPEG Column: 137th MPEG Meeting (virtual/online)

The original blog post can be found at the Bitmovin Techblog and has been modified/updated here to focus on and highlight research aspects.

The 137th MPEG meeting was once again held as an online meeting, and the official press release can be found here and comprises the following items:

  • MPEG Systems Wins Two More Technology & Engineering Emmy® Awards
  • MPEG Audio Coding selects 6DoF Technology for MPEG-I Immersive Audio
  • MPEG Requirements issues Call for Proposals for Encoder and Packager Synchronization
  • MPEG Systems promotes MPEG-I Scene Description to the Final Stage
  • MPEG Systems promotes Smart Contracts for Media to the Final Stage
  • MPEG Systems further enhanced the ISOBMFF Standard
  • MPEG Video Coding completes Conformance and Reference Software for LCEVC
  • MPEG Video Coding issues Committee Draft of Conformance and Reference Software for MPEG Immersive Video
  • JVET produces Second Editions of VVC & VSEI and finalizes VVC Reference Software
  • JVET promotes Tenth Edition of AVC to Final Draft International Standard
  • JVET extends HEVC for High-Capability Applications up to 16K and Beyond
  • MPEG Genomic Coding evaluated Responses on New Advanced Genomics Features and Technologies
  • MPEG White Papers
    • Neural Network Coding (NNC)
    • Low Complexity Enhancement Video Coding (LCEVC)
    • MPEG Immersive video

In this column, I’d like to focus on the Emmy® Awards, video coding updates (AVC, HEVC, VVC, and beyond), and a brief update about DASH (as usual).

MPEG Systems Wins Two More Technology & Engineering Emmy® Awards

MPEG Systems is pleased to report that MPEG is being recognized this year by the National Academy for Television Arts and Sciences (NATAS) with two Technology & Engineering Emmy® Awards, for (i) “standardization of font technology for custom downloadable fonts and typography for Web and TV devices and for (ii) “standardization of HTTP encapsulated protocols”, respectively.

The first of these Emmys is related to MPEG’s Open Font Format (ISO/IEC 14496-22) and the second of these Emmys is related to MPEG Dynamic Adaptive Streaming over HTTP (i.e., MPEG DASH, ISO/IEC 23009). The MPEG DASH standard is the only commercially deployed international standard technology for media streaming over HTTP and it is widely used in many products. MPEG developed the first edition of the DASH standard in 2012 in collaboration with 3GPP and since then has produced four more editions amending the core specification by adding new features and extended functionality. Furthermore, MPEG has developed six other standards as additional “parts” of ISO/IEC 23009 enabling the effective use of the MPEG DASH standards with reference software and conformance testing tools, guidelines, and enhancements for additional deployment scenarios. MPEG DASH has dramatically changed the streaming industry by providing a standard that is widely adopted by various consortia such as 3GPP, ATSC, DVB, and HbbTV, and across different sectors. The success of this standard is due to its technical excellence, large participation of the industry in its development, addressing the market needs, and working with all sectors of industry all under ISO/IEC JTC 1/SC 29 MPEG Systems’ standard development practices and leadership.

These are MPEG’s fifth and sixth Technology & Engineering Emmy® Awards (after MPEG-1 and MPEG-2 together with JPEG in 1996, Advanced Video Coding (AVC) in 2008, MPEG-2 Transport Stream in 2013, and ISO Base Media File Format in 2021) and MPEG’s seventh and eighth overall Emmy® Awards (including the Primetime Engineering Emmy® Awards for Advanced Video Coding (AVC) High Profile in 2008 and High-Efficiency Video Coding (HEVC) in 2017).

I have been actively contributing to the MPEG DASH standard since its inception. My initial blog post dates back to 2010 and the first edition of MPEG DASH was published in 2012. A more detailed MPEG DASH timeline provides many pointers to the Institute of Information Technology (ITEC) at the Alpen-Adria-Universität Klagenfurt and its DASH activities that is now continued within the Christian Doppler Laboratory ATHENA. In the end, the MPEG DASH community of contributors to and users of the standards can be very proud of this achievement only after 10 years of the first edition being published. Thus, also happy 10th birthday MPEG DASH and what a nice birthday gift.

Video Coding Updates

In terms of video coding, there have been many updates across various standards’ projects at the 137th MPEG Meeting.

Advanced Video Coding

Starting with Advanced Video Coding (AVC), the 10th edition of Advanced Video Coding (AVC, ISO/IEC 14496-10 | ITU-T H.264) has been promoted to Final Draft International Standard (FDIS) which is the final stage of the standardization process. Beyond various text improvements, this specifies a new SEI message for describing the shutter interval applied during video capture. This can be variable in video cameras, and conveying this information can be valuable for analysis and post-processing of the decoded video.

High-Efficiency Video Coding

The High-Efficiency Video Coding (HEVC, ISO/IEC 23008-2 | ITU-T H.265) standard has been extended to support high-capability applications. It defines new levels and tiers providing support for very high bit rates and video resolutions up to 16K, as well as defining an unconstrained level. This will enable the usage of HEVC in new application domains, including professional, scientific, and medical video sectors.

Versatile Video Coding

The second editions of Versatile Video Coding (VVC, ISO/IEC 23090-3 | ITU-T H.266) and Versatile supplemental enhancement information messages for coded video bitstreams (VSEI, ISO/IEC 23002-7 | ITU-T H.274) have reached FDIS status. The new VVC version defines profiles and levels supporting larger bit depths (up to 16 bits), including some low-level coding tool modifications to obtain improved compression efficiency with high bit-depth video at high bit rates. VSEI version 2 adds SEI messages giving additional support for scalability, multi-view, display adaptation, improved stream access, and other use cases. Furthermore, a Committee Draft Amendment (CDAM) for the next amendment of VVC was issued to begin the formal approval process to enable linking VVC with the Green Metadata (ISO/IEC 23001-11) and Video Decoding Interface (ISO/IEC 23090-13) standards and add a new unconstrained level for exceptionally high capability applications such as certain uses in professional, scientific, and medical application scenarios. Finally, the reference software package for VVC (ISO/IEC 23090-16) was also completed with its achievement of FDIS status. Reference software is extremely helpful for developers of VVC devices, helping them in testing their implementations for conformance to the video coding specification.

Beyond VVC

The activities in terms of video coding beyond VVC capabilities, the Enhanced Compression Model (ECM 3.1) performance over VTM-11.0 + JVET-V0056 (i.e., VVC reference software) shows an improvement of close to 15% for Random Access Main 10. This is indeed encouraging and, in general, these activities are currently managed within two exploration experiments (EEs). The first is on neural network-based (NN) video coding technology (EE1) and the second is on enhanced compression beyond VVC capability (EE2). EE1 currently plans to further investigate (i) enhancement filters (loop and post) and (ii) super-resolution (JVET-Y2023). It will further investigate selected NN technologies on top of ECM 4 and the implementation of selected NN technologies in the software library, for platform-independent cross-checking and integerization. Enhanced Compression Model 4 (ECM 4) comprises new elements on MRL for intra, various GPM/affine/MV-coding improvements including TM, adaptive intra MTS, coefficient sign prediction, CCSAO improvements, bug fixes, and encoder improvements (JVET-Y2025). EE2 will investigate intra prediction improvements, inter prediction improvements, improved screen content tools, and improved entropy coding (JVET-Y2024).

Research aspects: video coding performance is usually assessed in terms of compression efficiency or/and encoding runtime (time complexity). Another aspect is related to visual quality, its assessment, and metrics, specifically for neural network-based video coding technologies.

The latest MPEG-DASH Update

Finally, I’d like to provide a brief update on MPEG-DASH! At the 137th MPEG meeting, MPEG Systems issued a draft amendment to the core MPEG-DASH specification (i.e., ISO/IEC 23009-1) about Extended Dependent Random Access Point (EDRAP) streaming and other extensions which it will be further discussed during the Ad-hoc Group (AhG) period (please join the dash email list for further details/announcements). Furthermore, Defects under Investigation (DuI) and Technologies under Consideration (TuC) are available here.

An updated overview of DASH standards/features can be found in the Figure below.

MPEG-DASH status of January 2021.

Research aspects: in the Christian Doppler Laboratory ATHENA we aim to research and develop novel paradigms, approaches, (prototype) tools and evaluation results for the phases (i) multimedia content provisioning (i.e., video coding), (ii) content delivery (i.e., video networking), and (iii) content consumption (i.e., video player incl. ABR and QoE) in the media delivery chain as well as for (iv) end-to-end aspects, with a focus on, but not being limited to, HTTP Adaptive Streaming (HAS).

The 138th MPEG meeting will be again an online meeting in July 2022. Click here for more information about MPEG meetings and their developments.